NFL scores › Week 8 › Colts at Jaguars
EverBank Stadium
BEAVERJAX −7.5, leanleanOver 46.5, leanleanBEAVER gives JAX 72% to win
Lines
Tap a price to add it to your slip. Circled is BEAVER’s pick: solid for a best bet, dashed for a lean.SpreadTotalMoney Colts
 Jaguars
ColtsJaguarsBEAVER’s card
LeanJAX −7.5, lean0.3 points off the line
- Over 46.5 lean, 0.2 points off the line
BEAVER against the market
Updates until kickoff| BEAVER | Market | Call | |
|---|---|---|---|
| Score (IND–JAX) | 19–27 | – | |
| Spread | JAX −7.8 | JAX −7.5 | JAX −7.5 |
| Total | 46.7 | 46.5 | Over 46.5 |
| JAX win chance | 72% | −395 |
IND by 8+
12%
IND by 1–7
16%
JAX by 1–7
23%
JAX by 8+
50%
Spread: 0.3 pts better than Vegas for Jaguars (sides with a gap this size have won 48% in the backtest). Total: 0.2 pts above Vegas (50% historically).
Player projections
typical game, with the likely range (middle half of outcomes) · ▲ 5%+ above his usual · all player props| Indianapolis Colts | |||
|---|---|---|---|
| Passing | Yds | ||
| Daniel Jones QB | 237157–288 | ||
| Rushing | Yds | ||
| Jonathan Taylor RB | 6743–92 | ||
| Seth McGowan RB | 125–33 | ||
| Daniel Jones QB | 92–19 | ||
| Receiving | Rec | Yds | |
| Tyler Warren TE | 4.83–7 | 4225–64 | |
| Keenan Allen WR | 3.82–6 | 3719–57 | |
| Josh Downs WR | 3.52–5 | 3620–60 | |
| Laquon Treadwell WR | 1.31–3 | 175–36 | |
| Jonathan Taylor RB | 2.51–3 | 166–29 | |
| Jacksonville Jaguars | |||
|---|---|---|---|
| Passing | Yds | ||
| Trevor Lawrence QB | 257199–308 | ||
| Rushing | Yds | ||
| Bhayshul Tuten RB | 4728–73 | ||
| Chris Rodriguez Jr. RB | 2311–46 | ||
| Trevor Lawrence QB | 144–26 | ||
| Receiving | Rec | Yds | |
| Parker Washington WR | 4.33–6 | 6238–95 | |
| Jakobi Meyers WR | 3.42–5 | 4322–68 | |
| Brenton Strange TE | 3.62–5 | 3921–60 | |
| Brian Thomas Jr. WR | 1.10–2 | 142–29 | |
| Josh Cameron WR | 1.00–2 | 120–30 | |
Tale of the tape
BEAVER Stats, opponent-adjusted, entering the game. Rank among 32 NFL teams.Efficiency
−0.004 #16Offense EPA / play+0.068 #7
+0.037 #26Defense EPA / play allowed−0.029 #9
+0.1% #14Offense success rate+2.9% #7
+0.6% #21Defense success rate allowed−0.8% #9
−0.074 #23Passing EPA / dropback+0.087 #7
+0.054 #26Pass defense EPA allowed−0.027 #10
+0.104 #3Rushing EPA / carry+0.039 #10
+0.031 #24Rush defense EPA allowed−0.057 #4
−0.040 #24Early-down EPA (1st & 2nd)+0.066 #5
+0.058 #30Early-down EPA allowed−0.010 #15
Scoring and special teams
+1.1 #10Scoring offense (pts vs avg)+2.6 #6
+2.2 #28Scoring defense (pts vs avg)−2.7 #4
+0.35 #9Special teams EPA / game+0.69 #4
Touchdown scorers
▲ good matchup vs. his usual · full TD boardIndianapolis Colts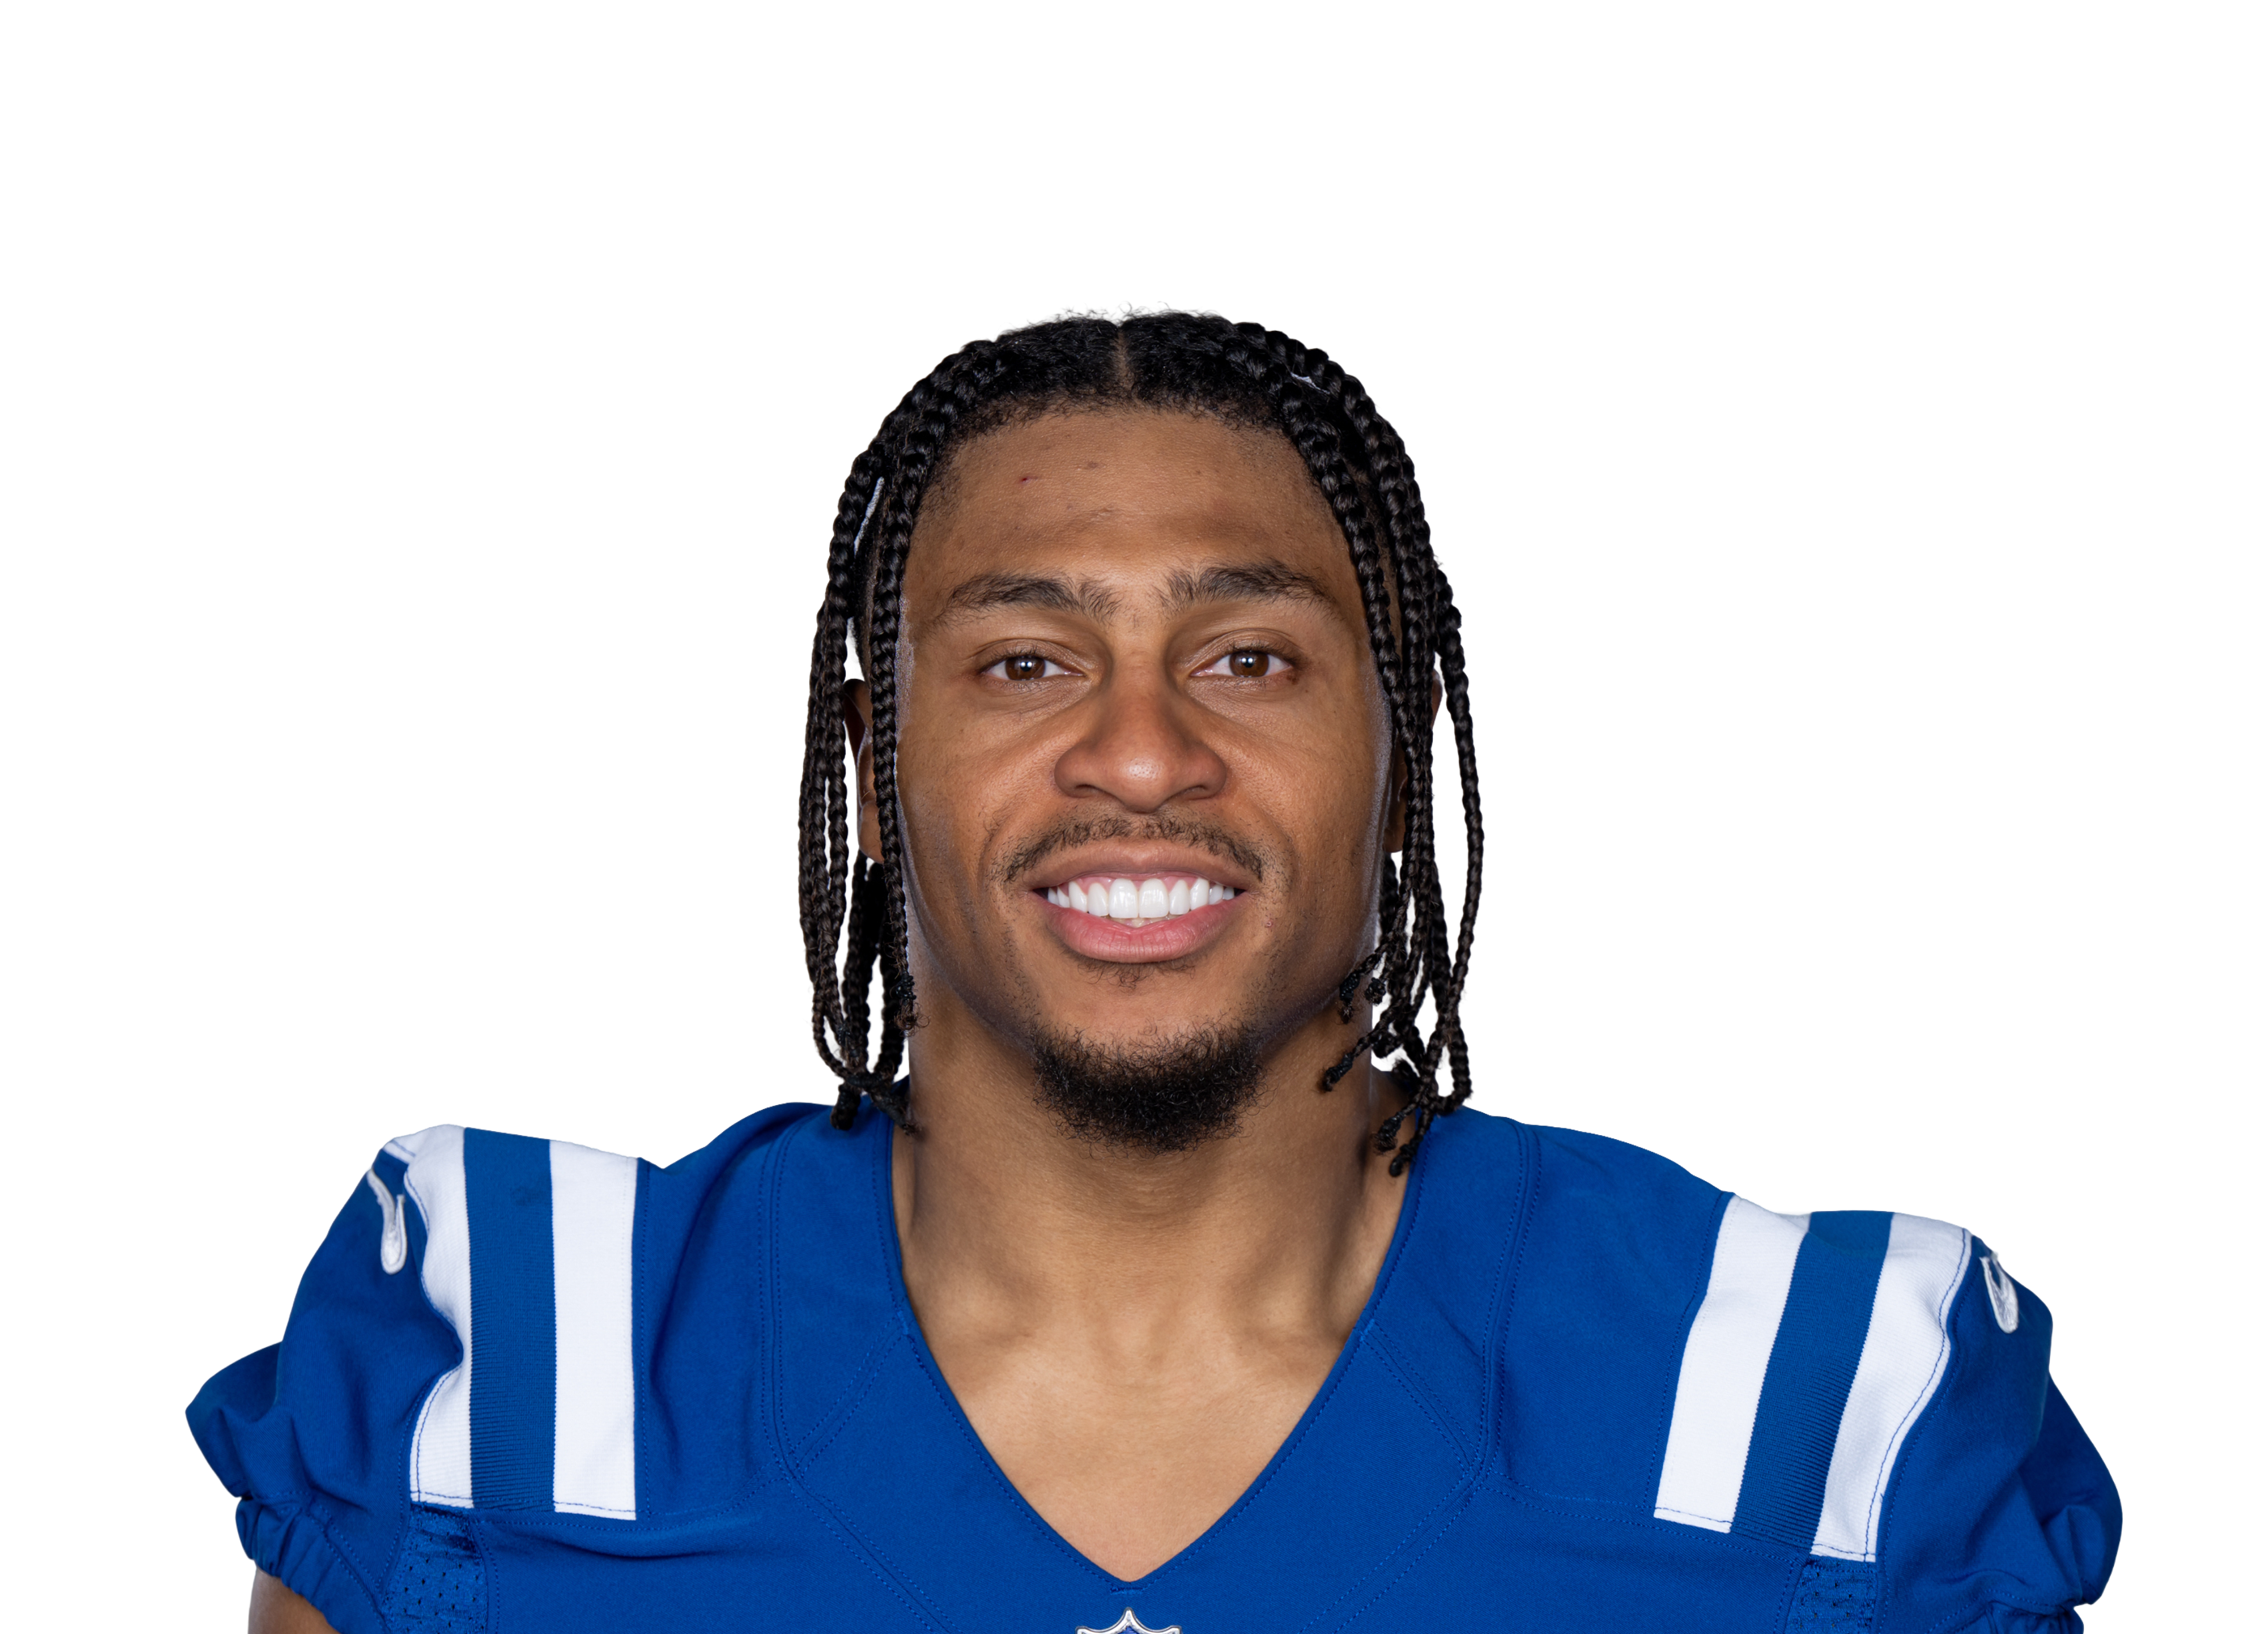
67% of the team's carries inside the 10 · Vegas has the Colts at about 20 points, 2 fewer than usual

25% of the team's end-zone targets · Vegas has the Colts at about 20 points, 2 fewer than usual

Vegas has the Colts at about 20 points, 2 fewer than usual
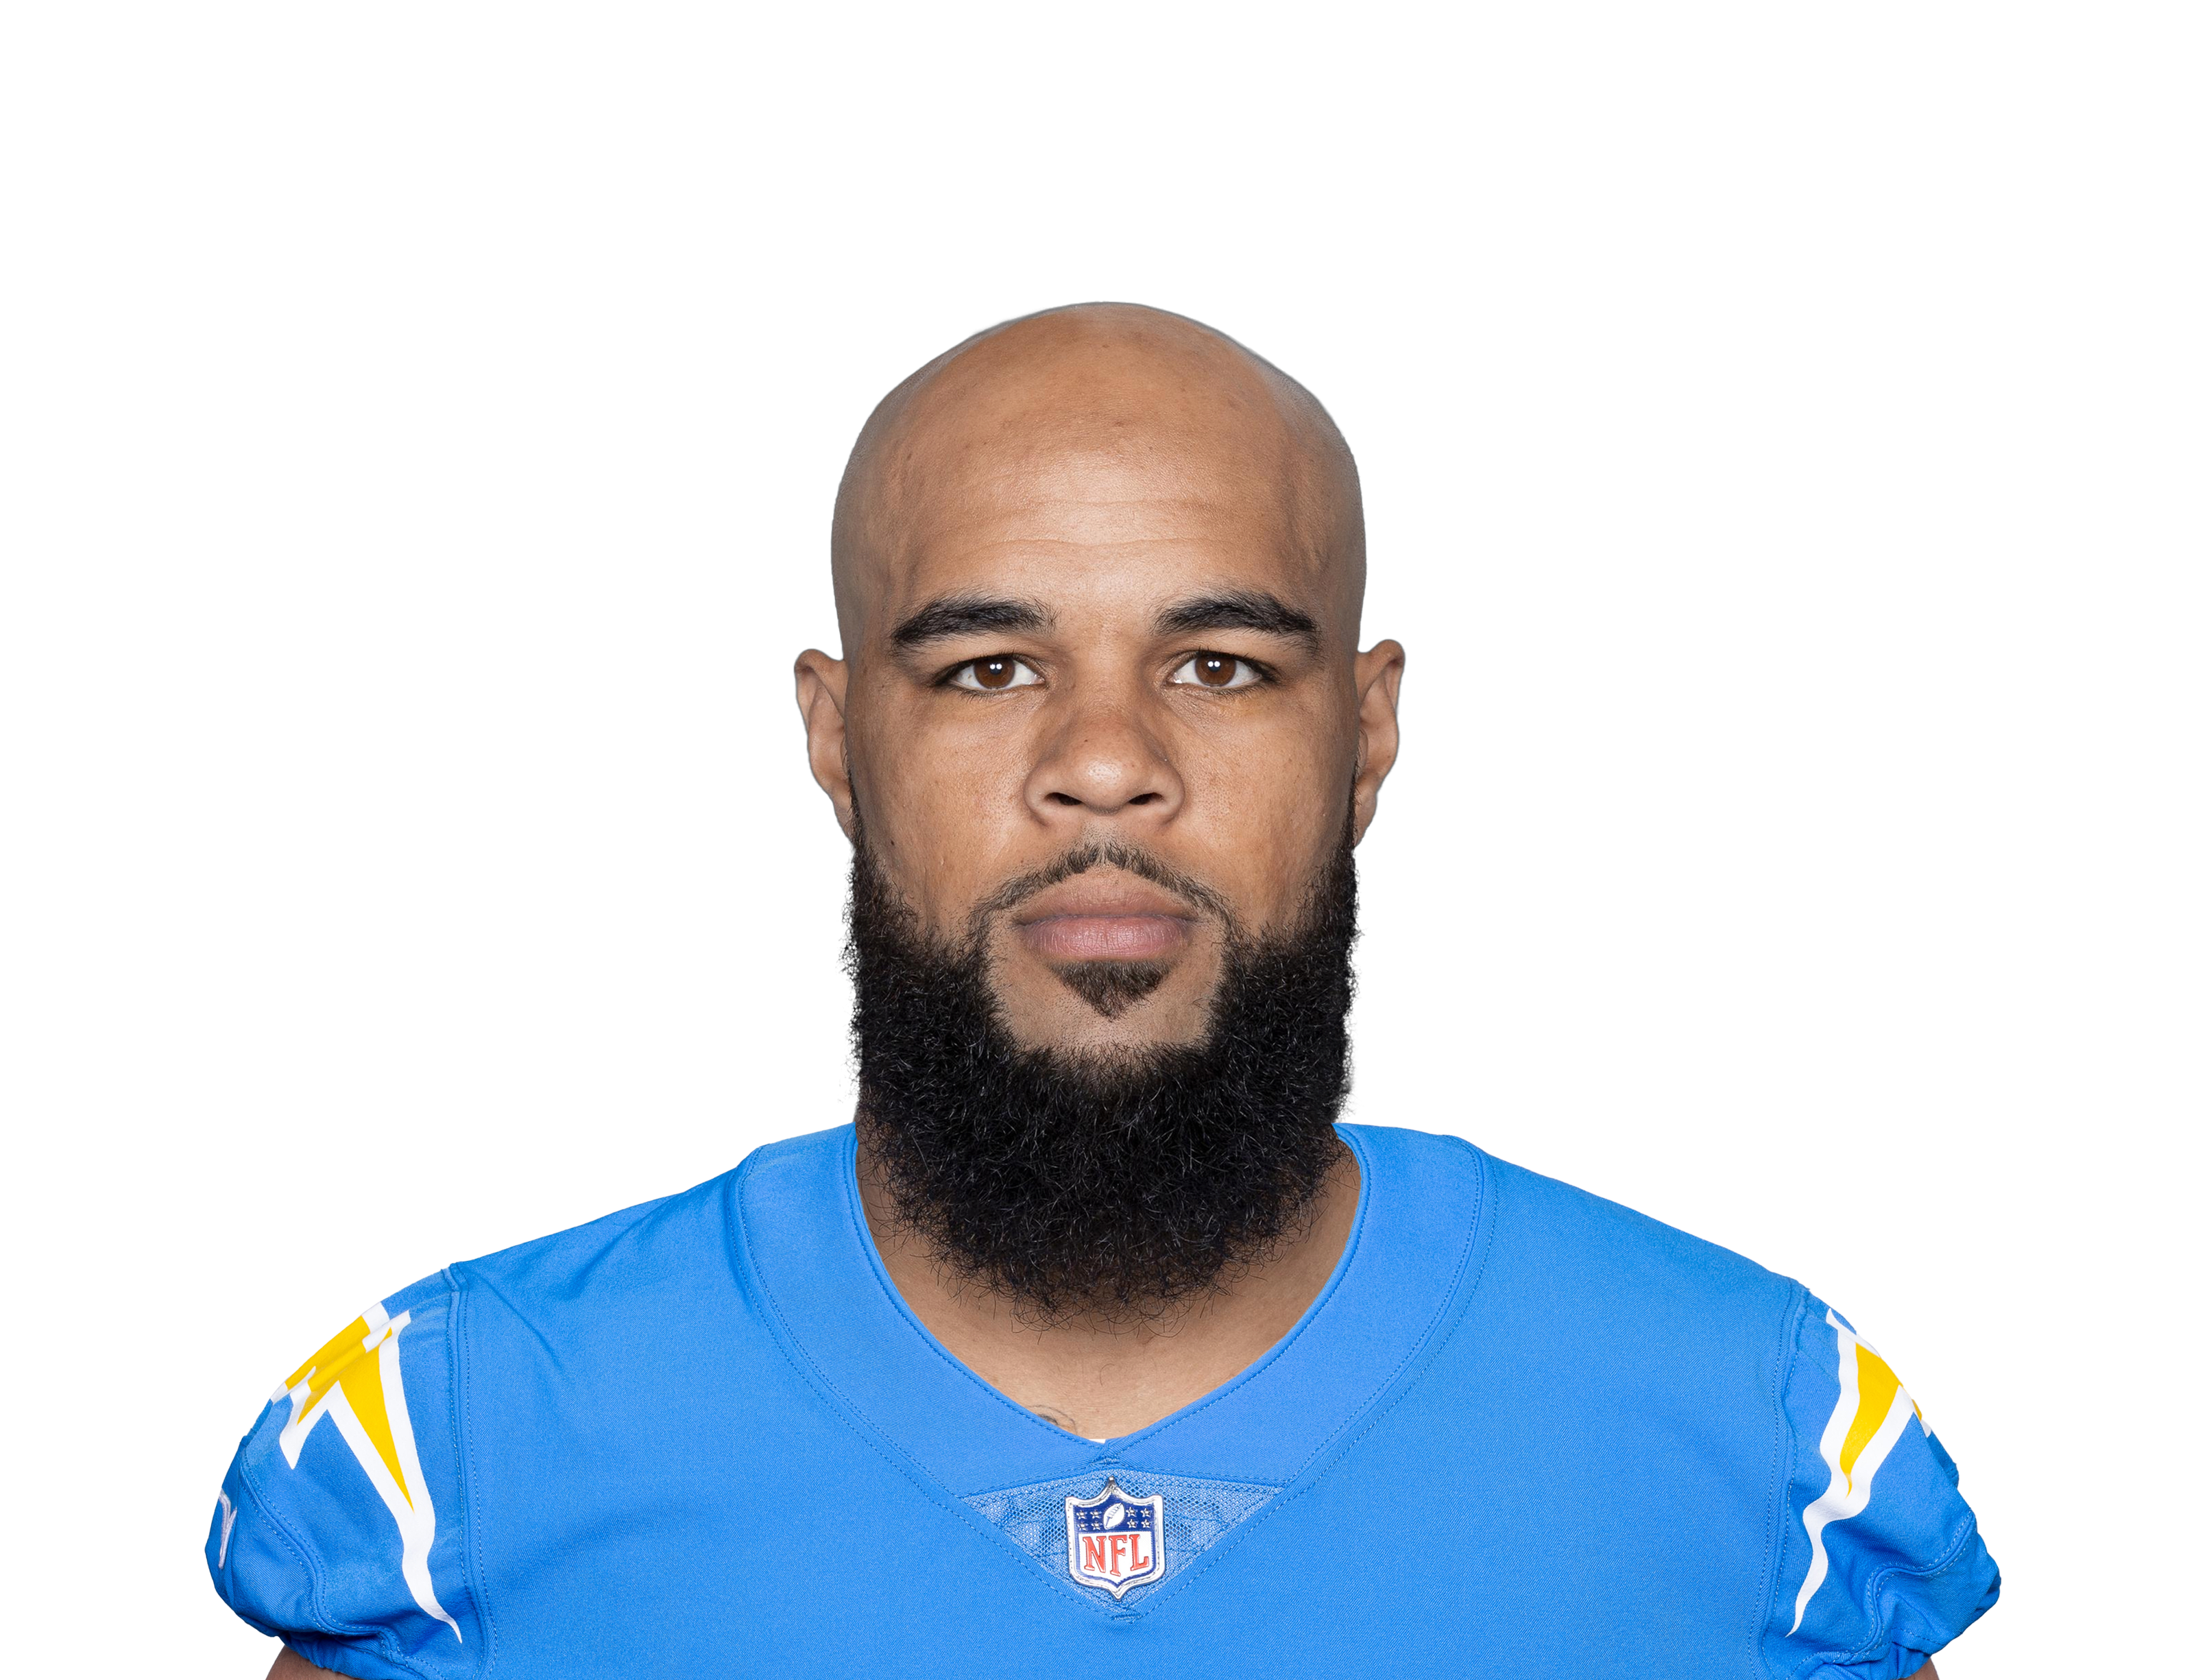
22% of the team's targets · Vegas has the Colts at about 20 points, 2 fewer than usual
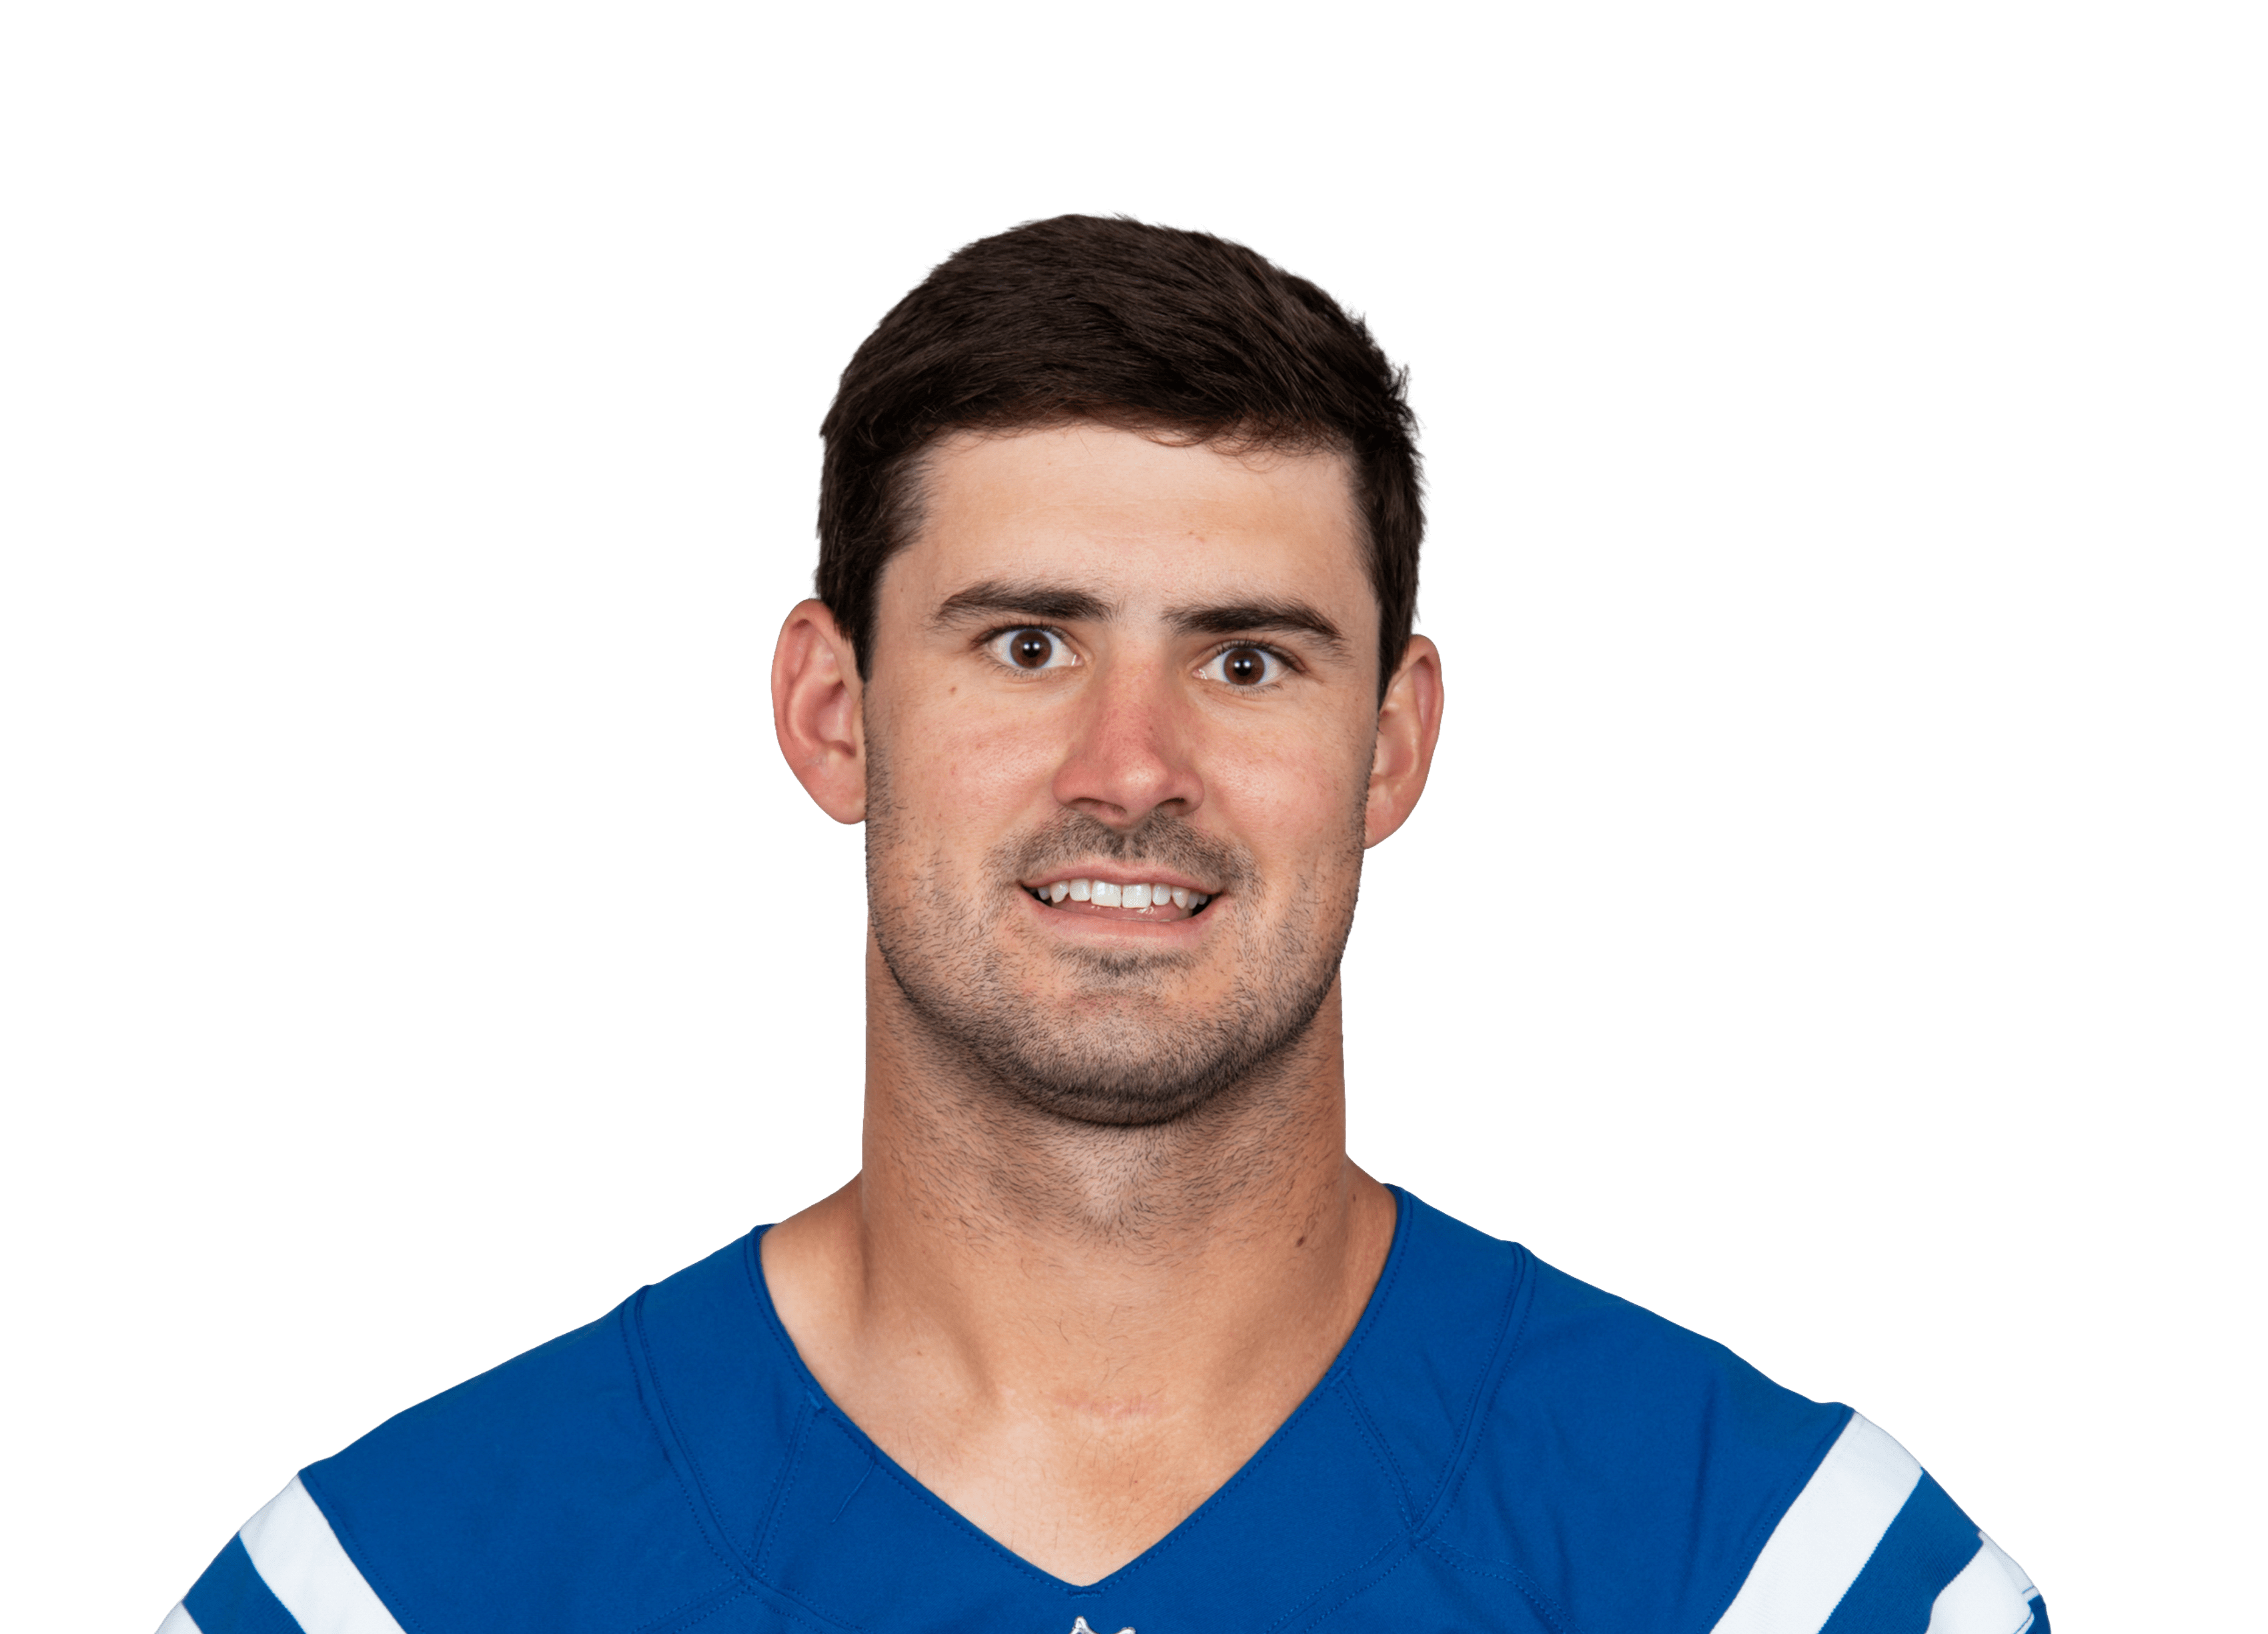
Vegas has the Colts at about 20 points, 2 fewer than usual
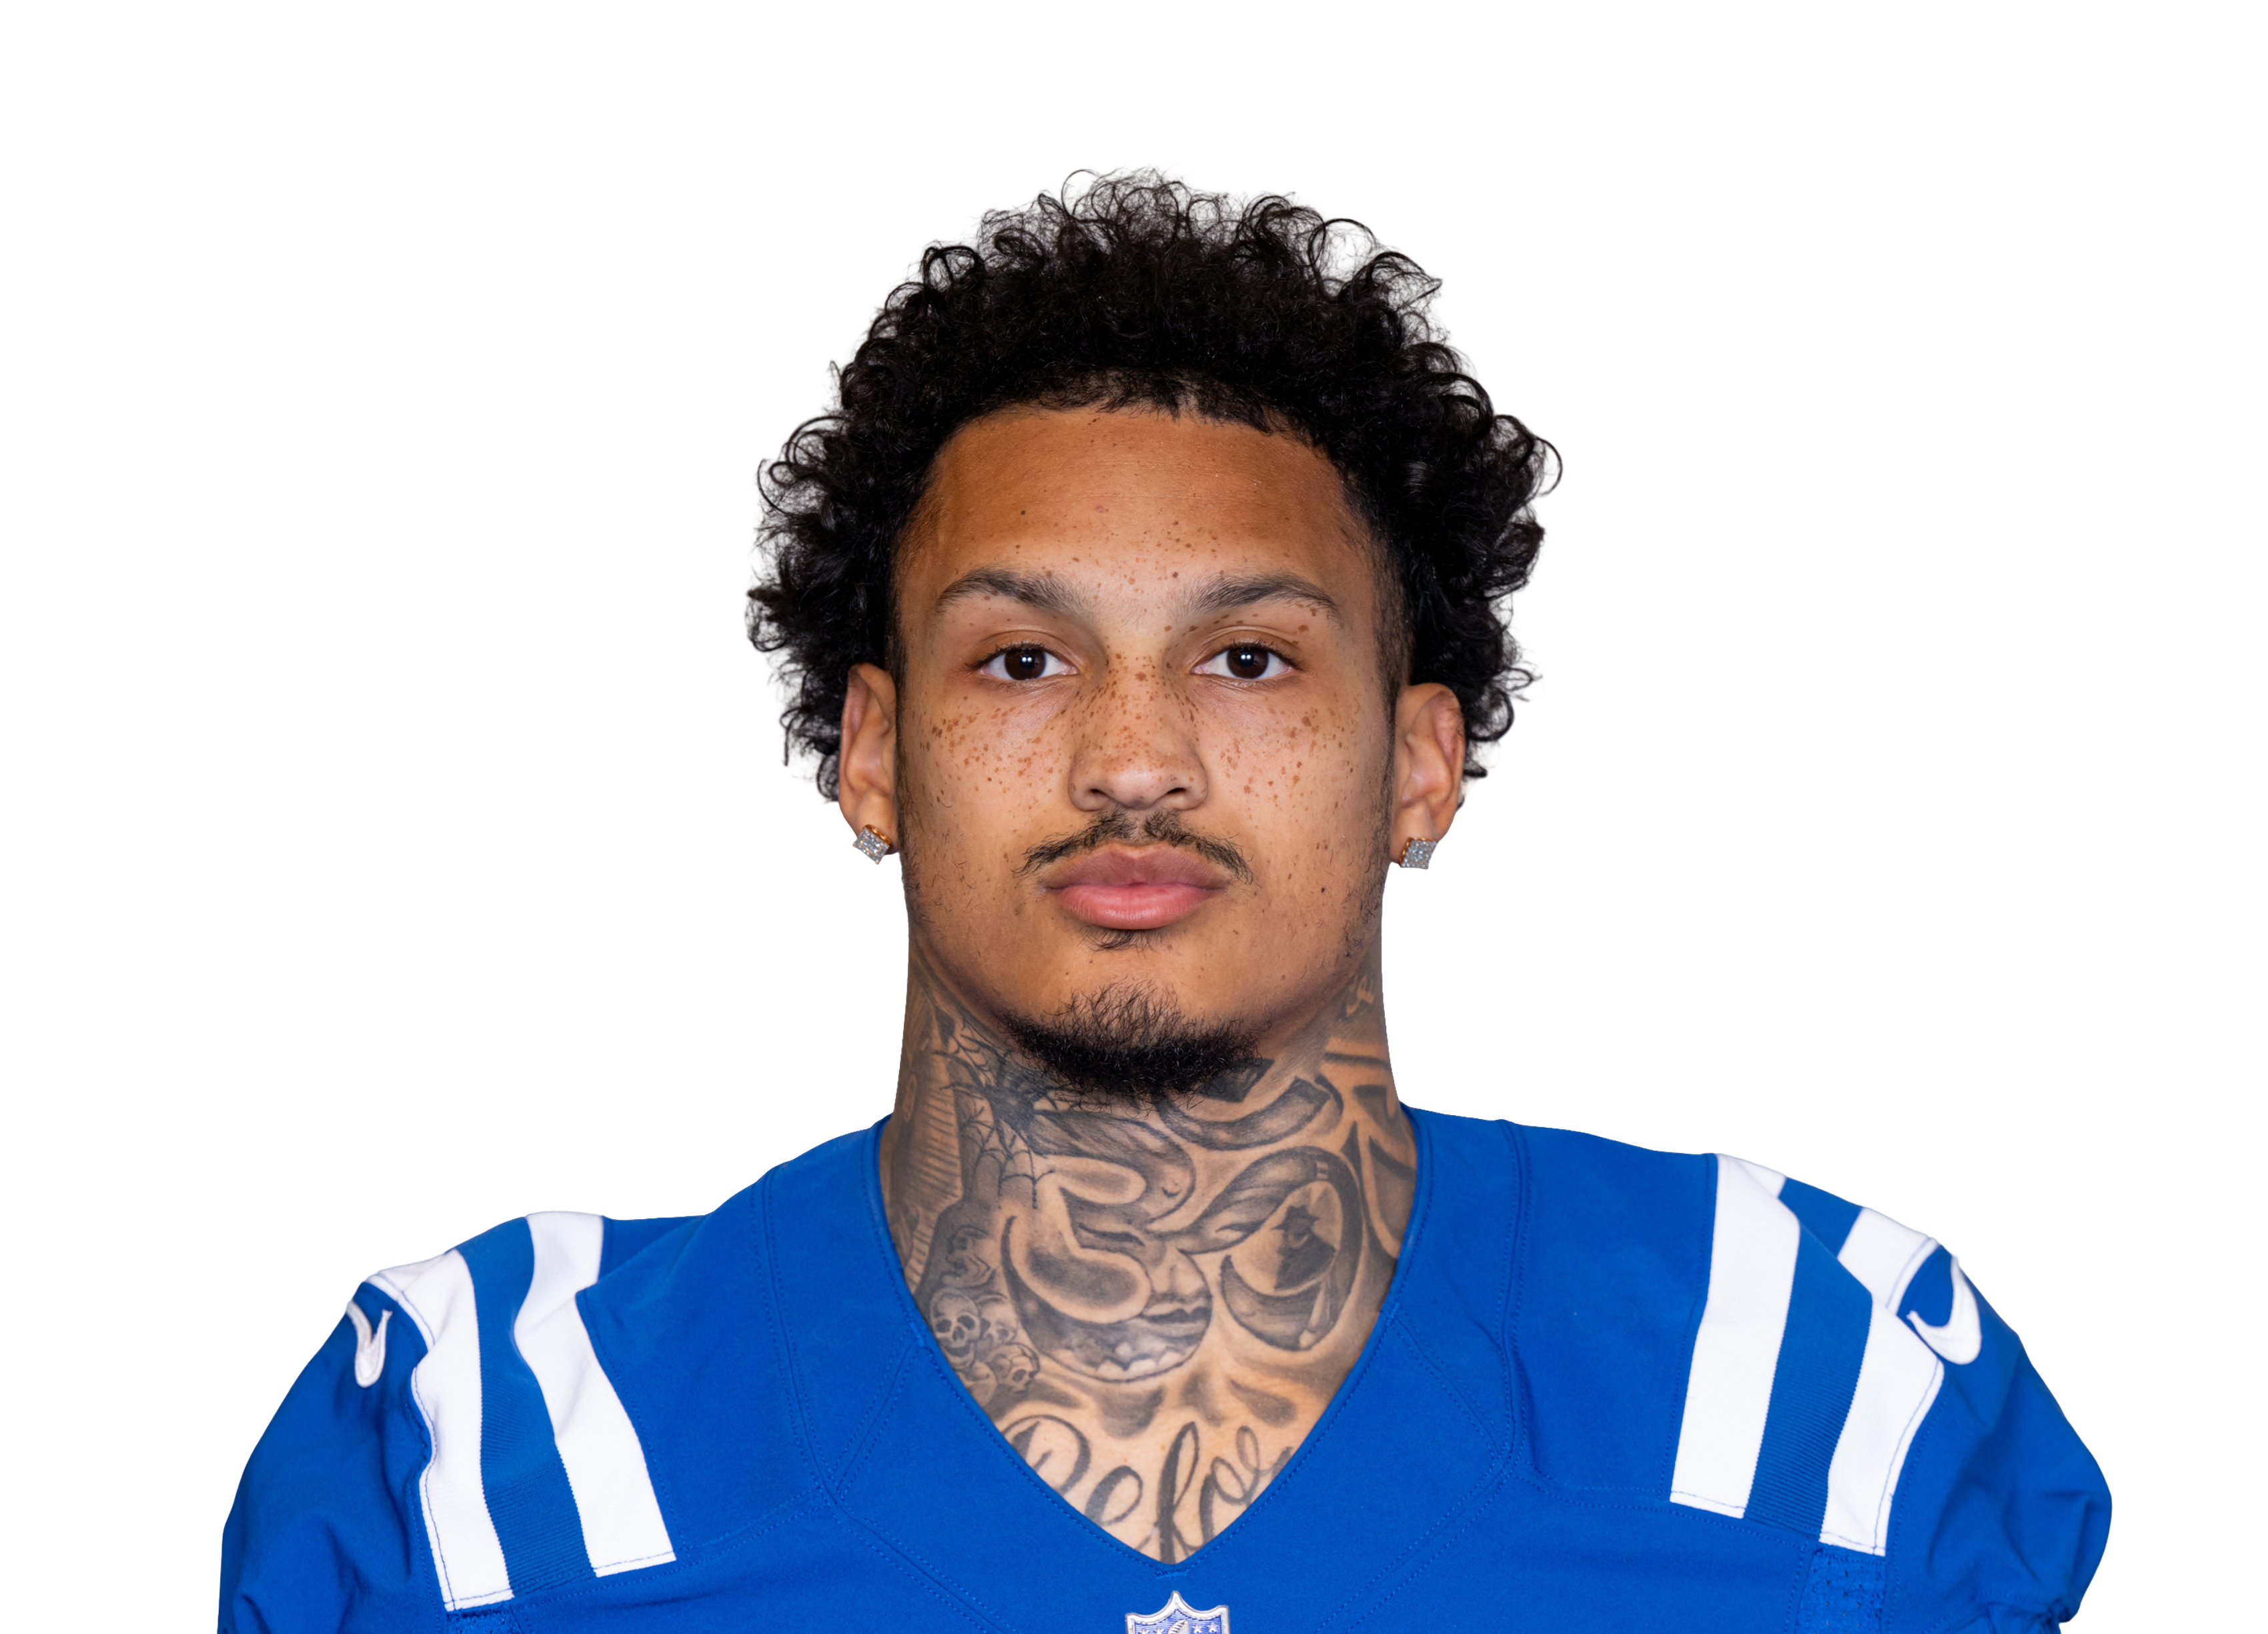
Vegas has the Colts at about 20 points, 2 fewer than usual
Jacksonville Jaguars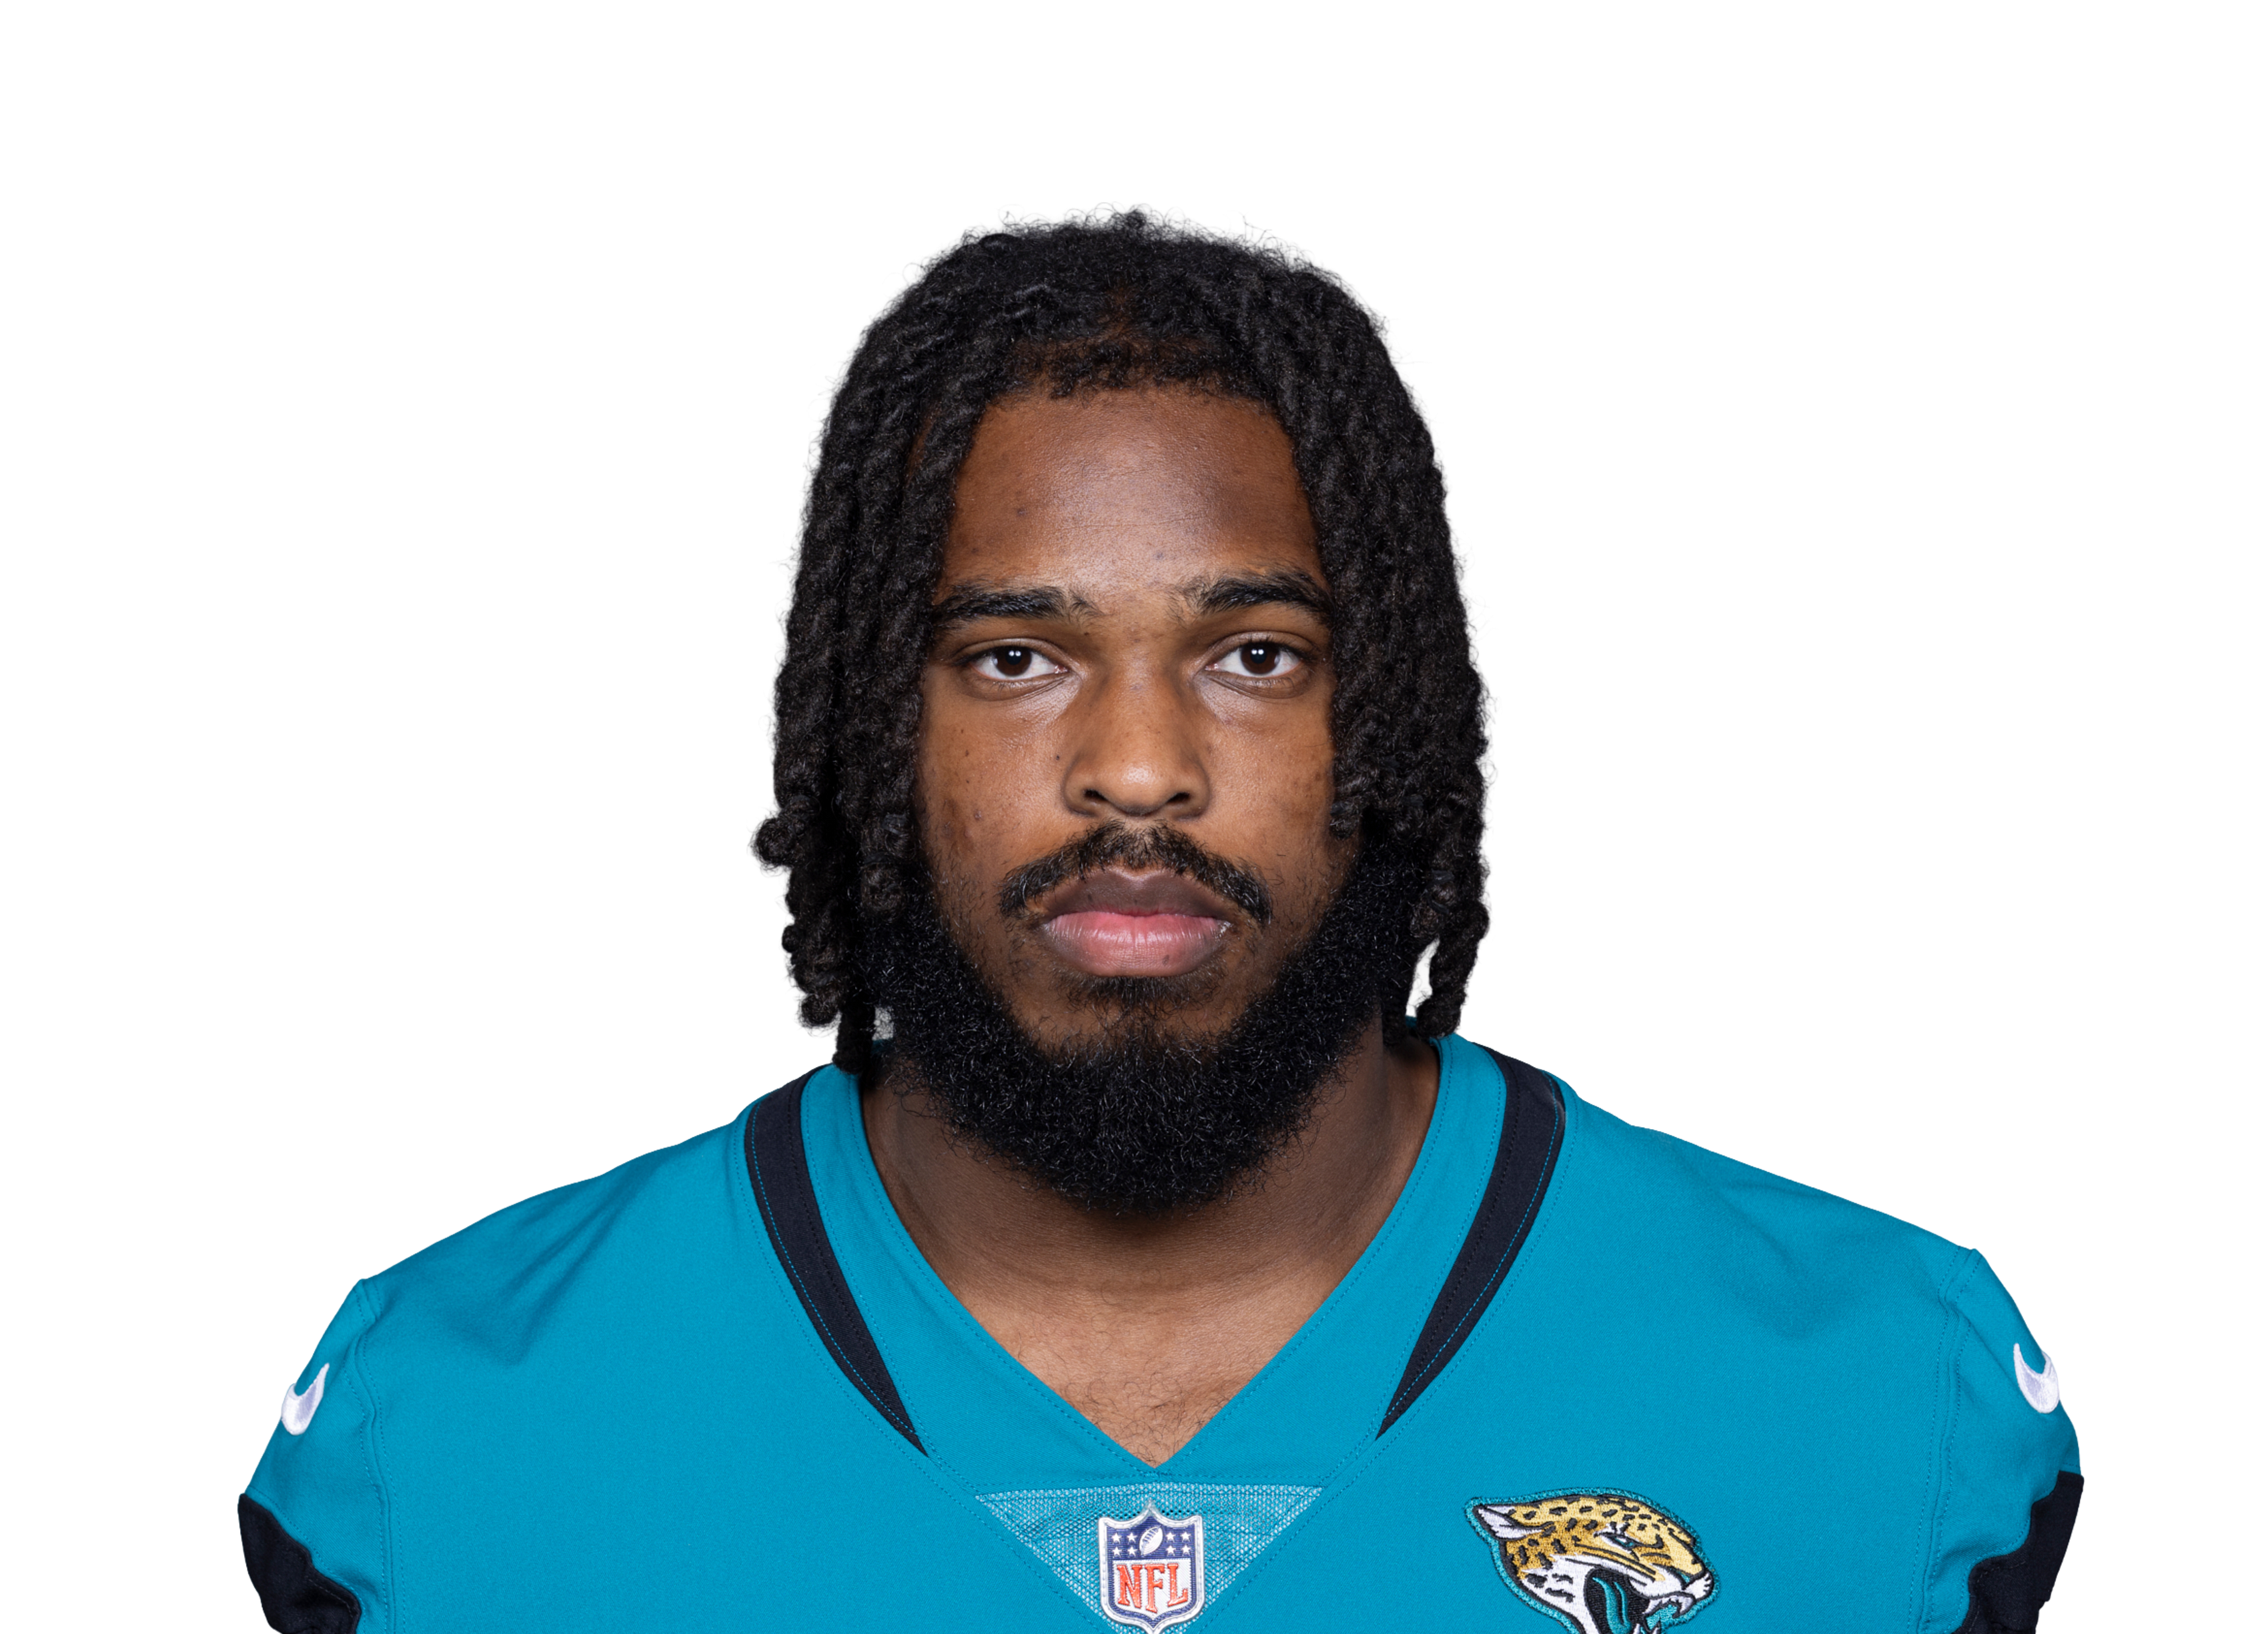
Vegas has the Jaguars at about 27 points, 4 more than usual · Several smaller matchup factors add up: Colts' defensive ratings and red-zone chances allowed lately
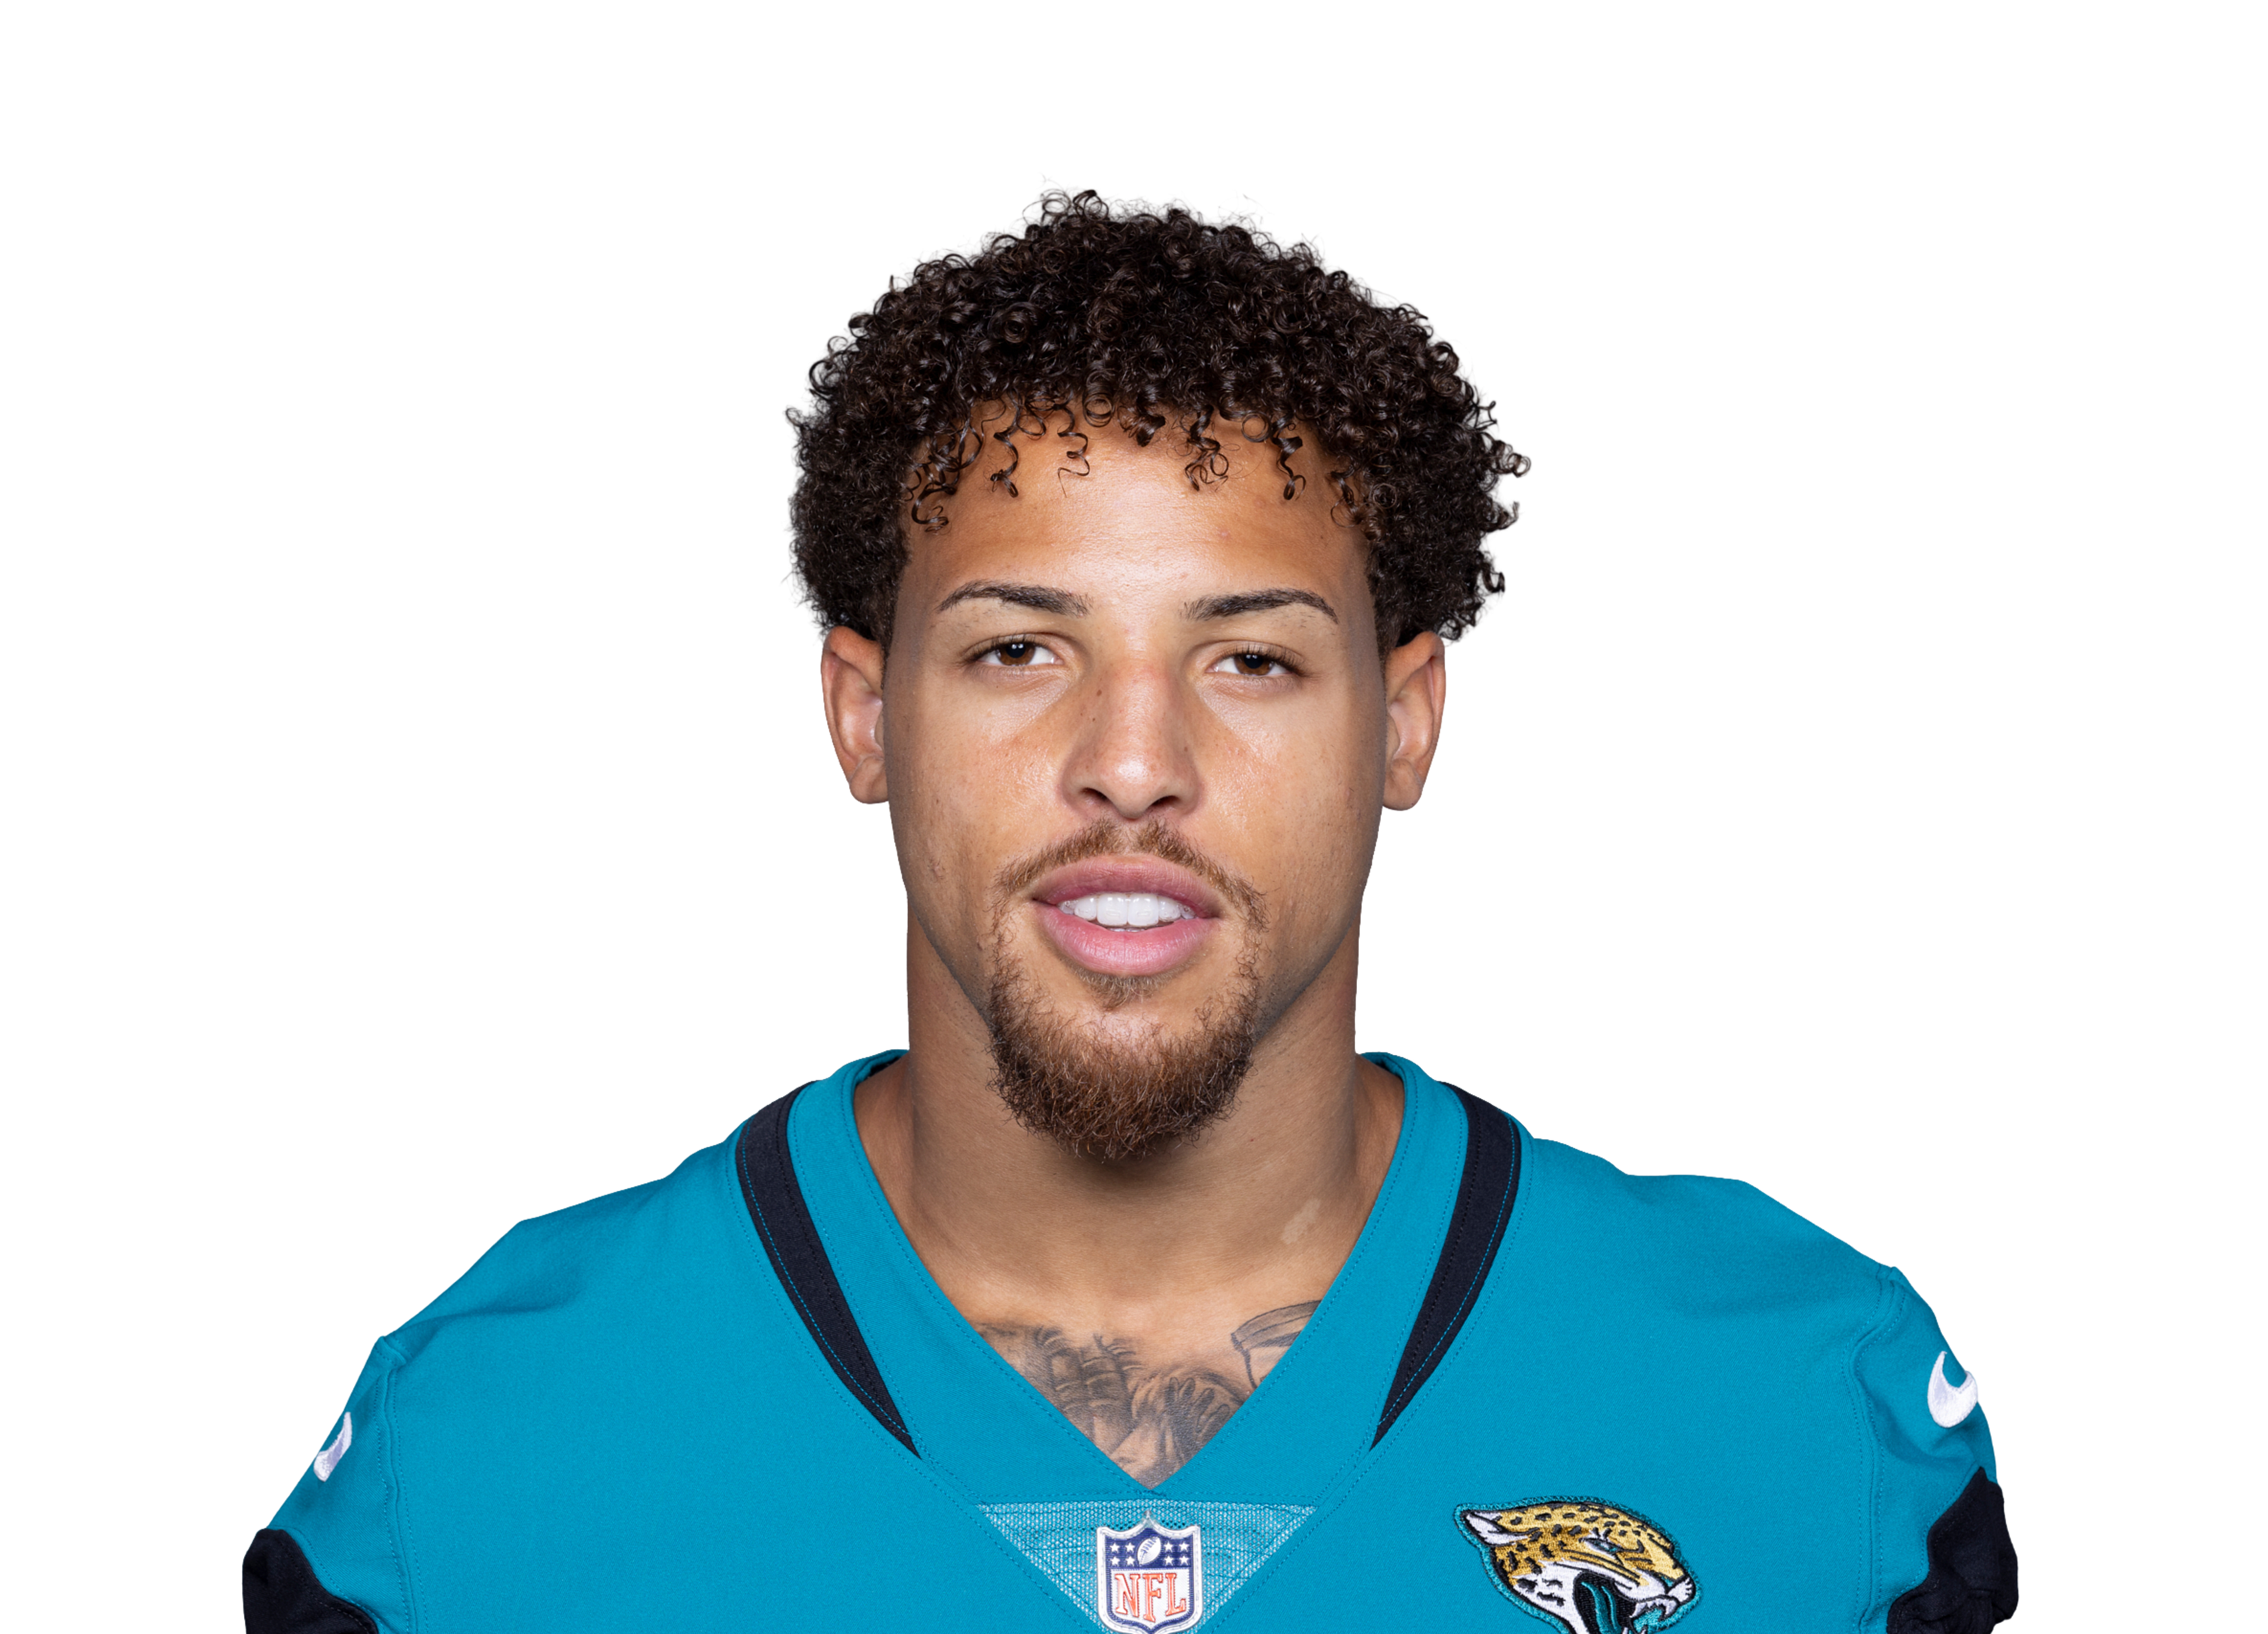
24% of the team's end-zone targets · Vegas has the Jaguars at about 27 points, 4 more than usual
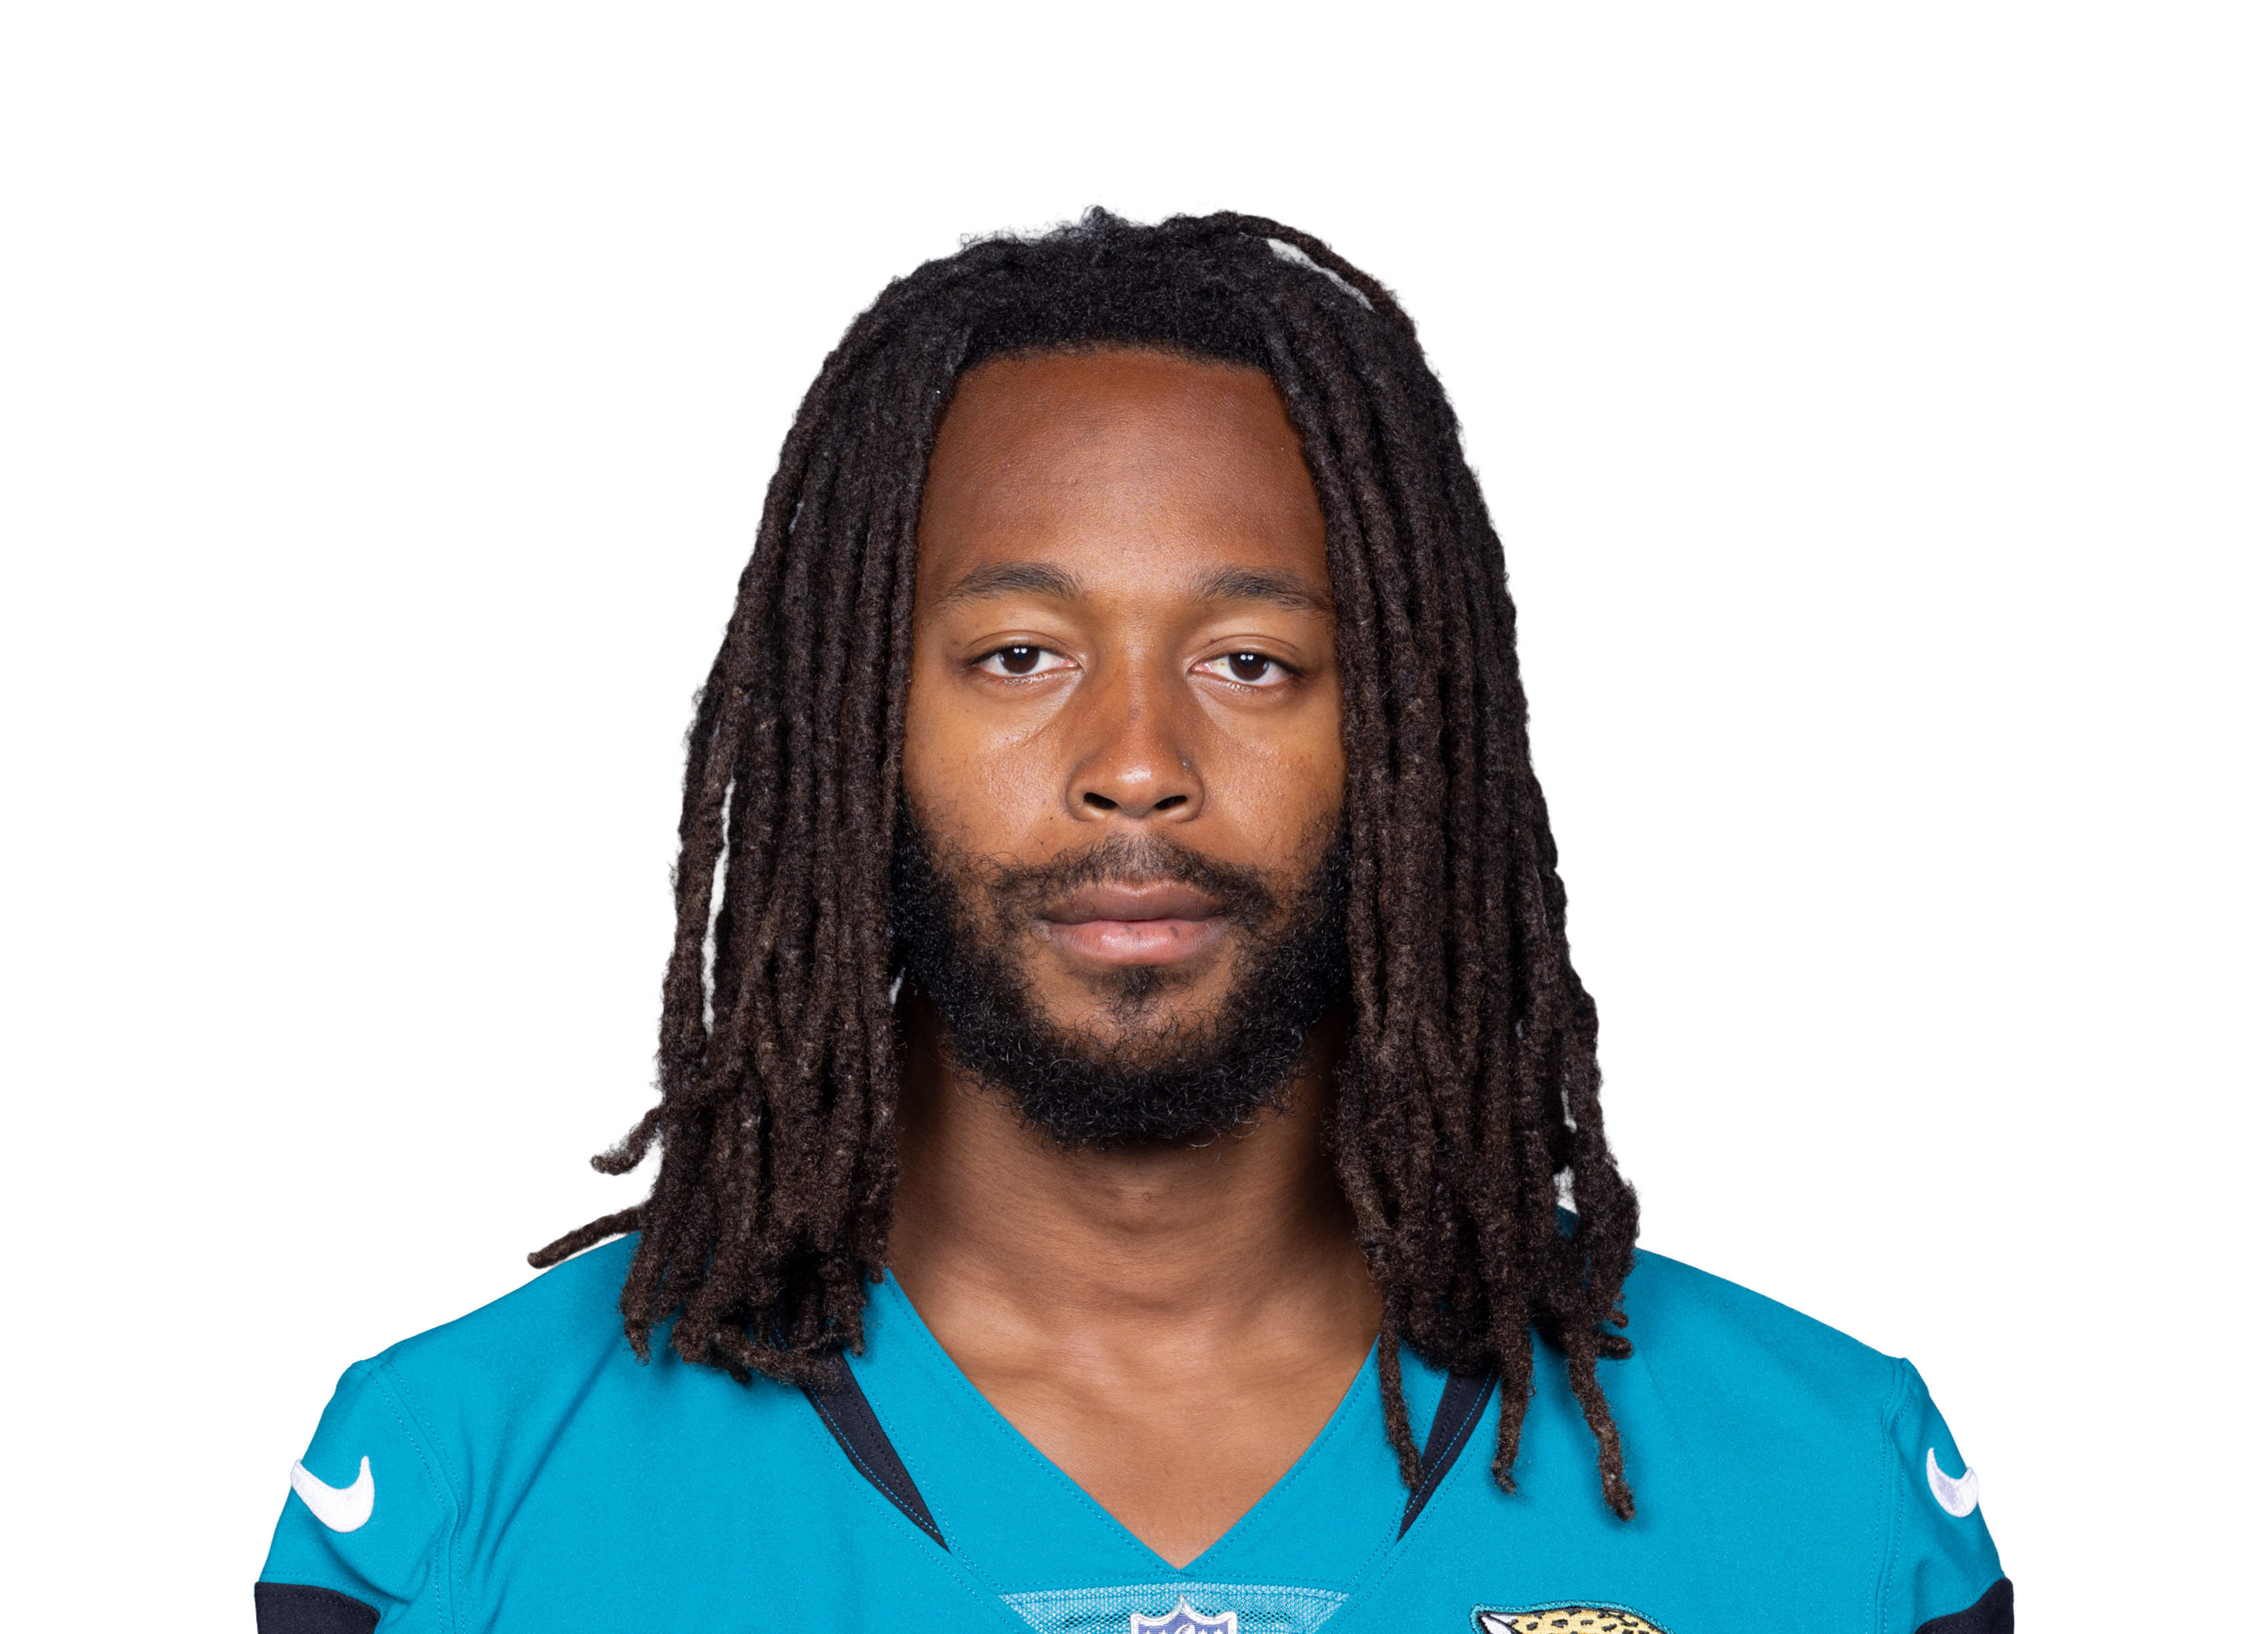
33% of the team's end-zone targets · Vegas has the Jaguars at about 27 points, 4 more than usual
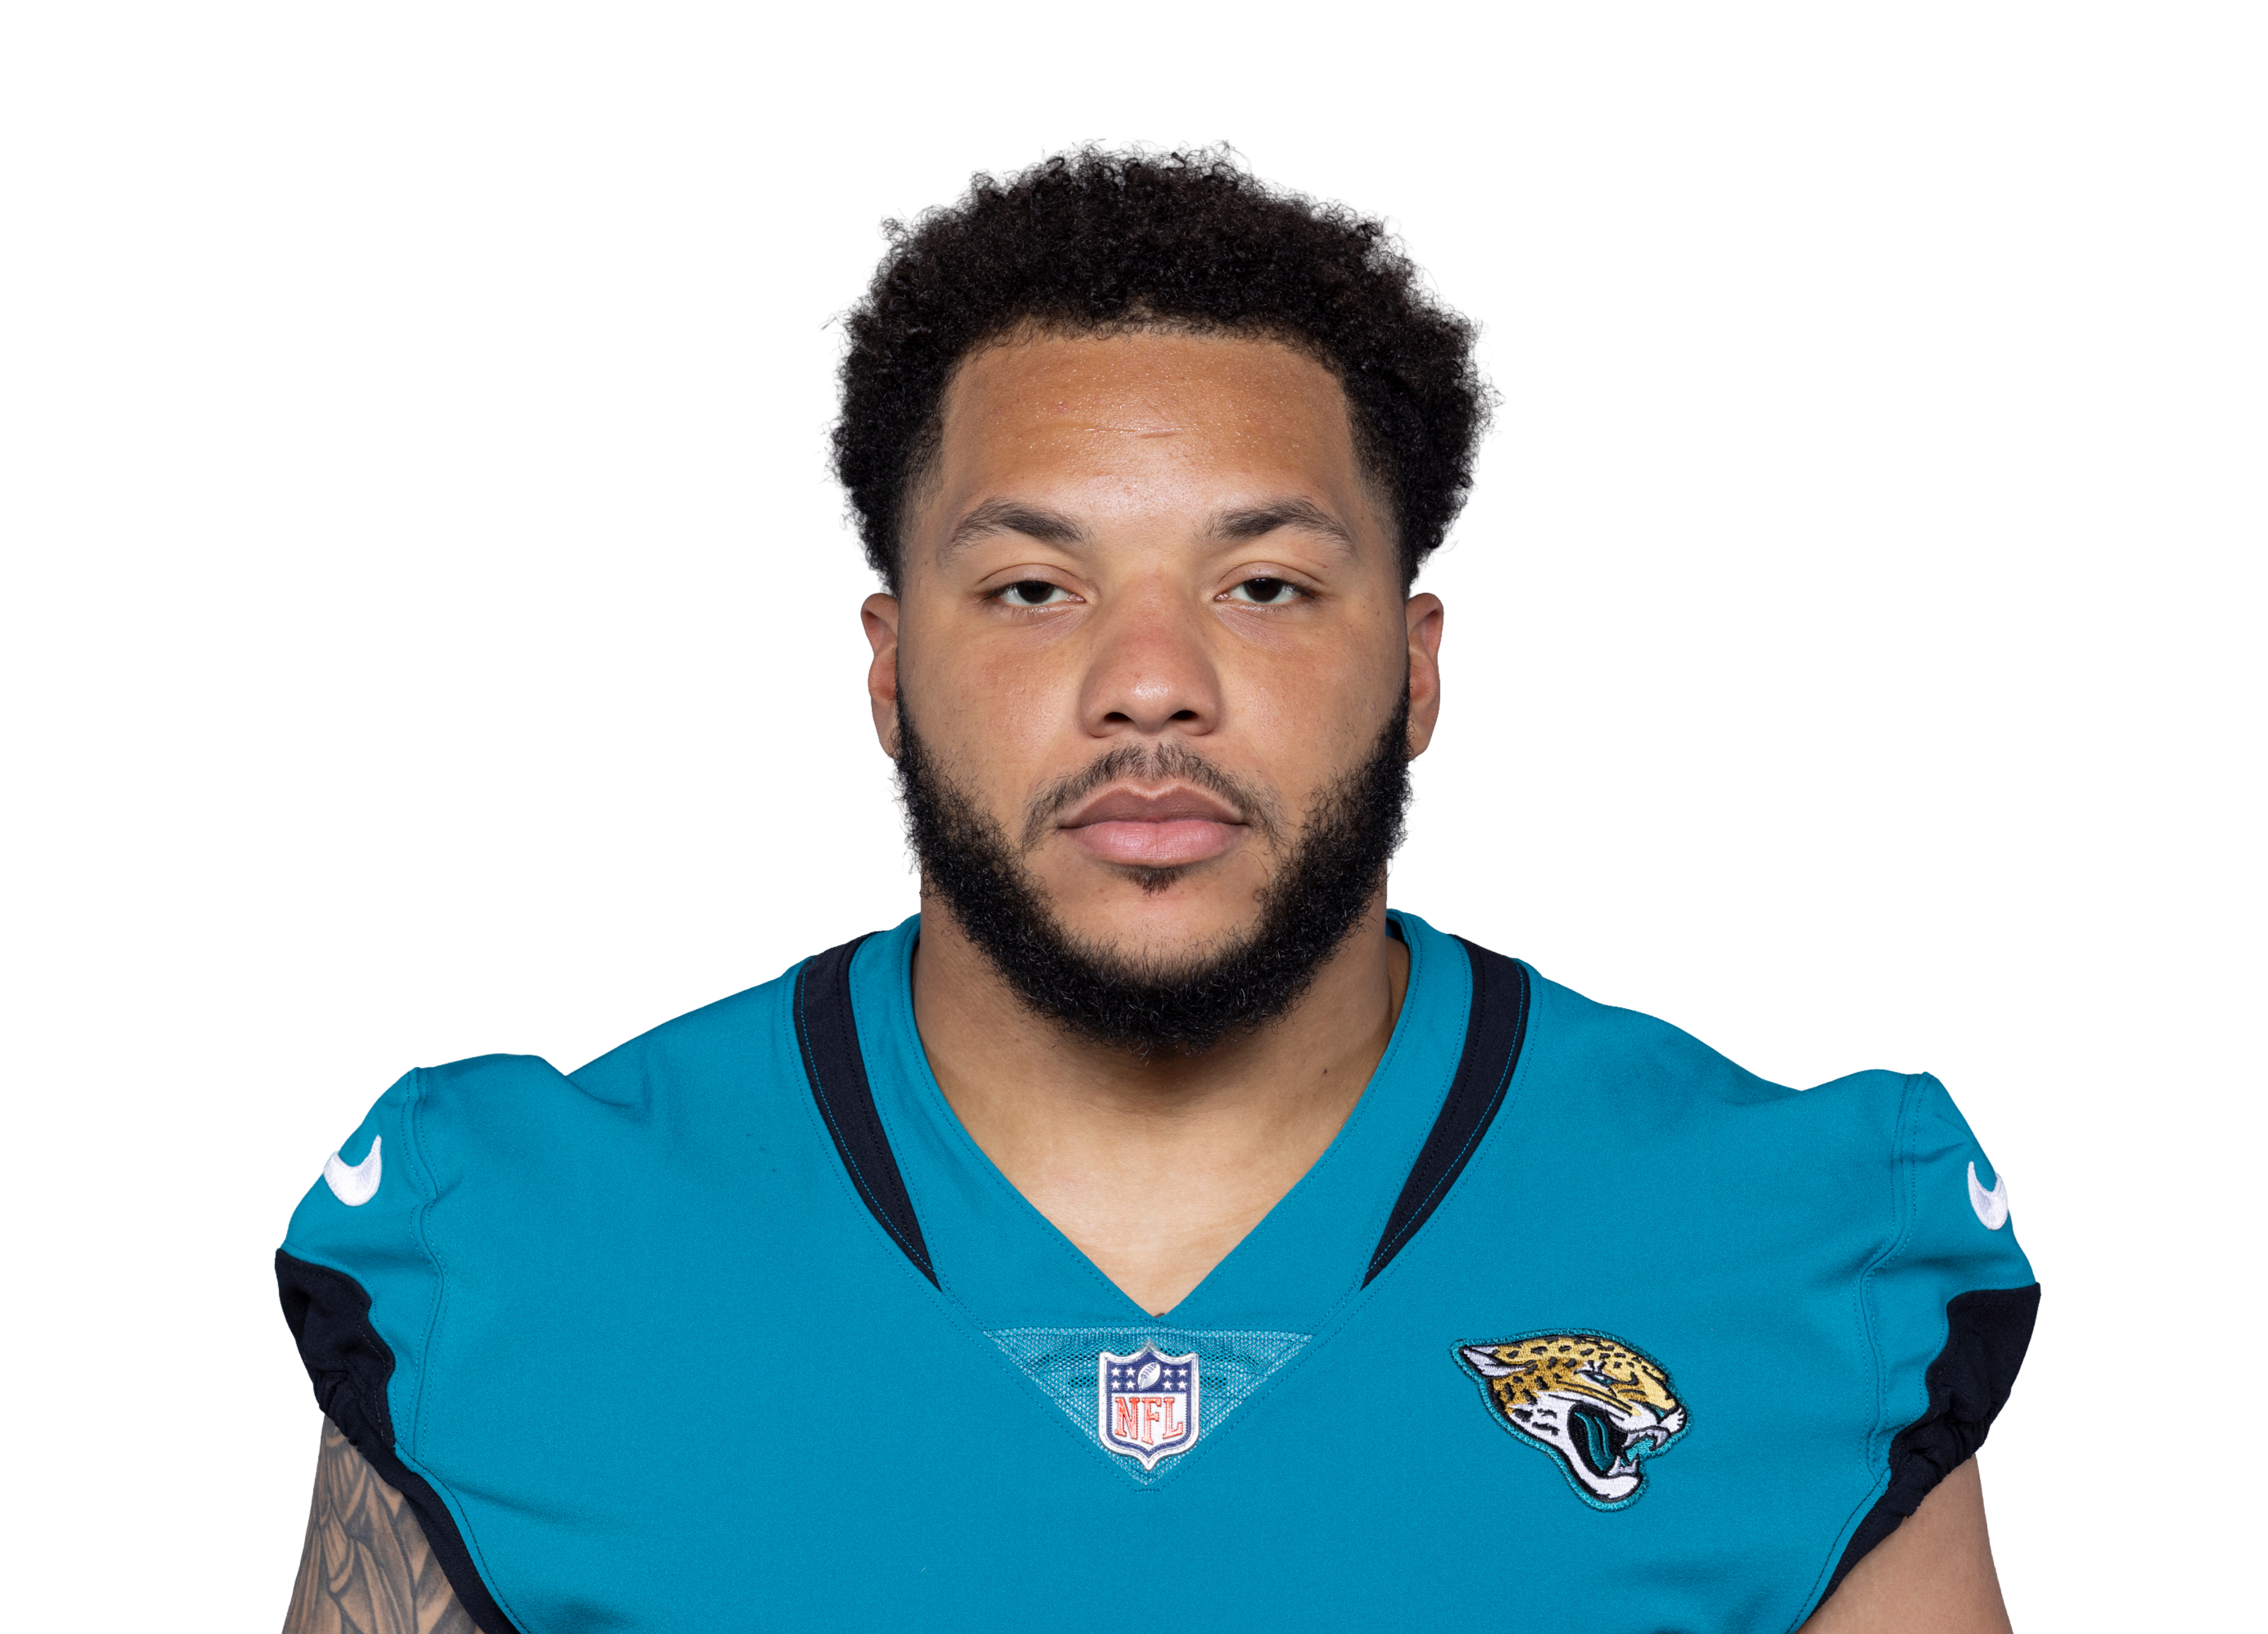
53% of the team's carries inside the 10 · Vegas has the Jaguars at about 27 points, 4 more than usual
Vegas has the Jaguars at about 27 points, 4 more than usual · Several smaller matchup factors add up: Colts' defensive ratings and red-zone chances allowed lately

Vegas has the Jaguars at about 27 points, 4 more than usual
Quarterbacks
career EPA per dropback (league average is about 0; older seasons count less)PROJECTED STARTER · Colts
Daniel Jones
EPA per dropback −0.05
PROJECTED STARTER · Jaguars
Trevor Lawrence
EPA per dropback +0.05
Injury report
players listed Out, Doubtful or Questionable this weekThe injury report for this game isn’t out yet (teams file them Wednesday through Friday).
Colts: last 5 games
| L10-16 | Covered | |
| L20-26 | Missed | |
| L22-34 | Missed | |
| W30-13 | Covered | |
| W19-17 | Covered |





Jaguars: last 5 games




Rating trend
BEAVER Stats: net EPA per play against an average team, entering each weekINDJAX
Loading the thread…
The box score fills in after the game.
Lines
Tap a price to add it to your slip. Circled is BEAVER’s pick: solid for a best bet, dashed for a lean.SpreadTotalMoneyColtsJaguars
ColtsJaguarsLines
latest from each book| Book | Spread | Total | Moneyline |
|---|---|---|---|
| Consensus | JAX −7.5 | 46.5 | IND +310 · JAX −395 |
| BEAVER fair line | JAX −7.8 | 46.7 | IND +262 · JAX −262 |
Loading…
Tendencies
Season to date. Against the spread and over/under use closing lines.| IND | JAX | |
|---|---|---|
| 2-5 | Record | 4-2 |
| 1-2 | Home | 2-0 |
| 1-3 | Away | 1-1 |
| 4-3 | Against the spread | 3-3 |
| 4-3 | Over/under | 2-4 |
| 22.0 / 25.7 | Points for / against | 25.7 / 17.3 |
| -3.7 | Avg margin | +8.3 |