NFL scores › Week 7 › Colts at Vikings
BEAVER MIN −6.5, lostBEAVER Over 41.5, lostBEAVER had MIN 71% to win
BEAVER against the market
Locked at kickoff, graded on the closing line| BEAVER | Market | Result | Call | |
|---|---|---|---|---|
| Score (IND–MIN) | 20–27 | – | 10–16 | |
| Spread | MIN −7.3 | MIN −6.5 | MIN by 6 | MIN −6.5 ✗ |
| Total | 46.3 | 41.5 | 26 | Over 41.5 ✗ |
| MIN win chance | 71% | −325 | Won |
IND by 8+
12%
IND by 1–7
17%
MIN by 1–7
23%
MIN by 8+
48%
Spread: 0.8 pts better than Vegas for Vikings (sides with a gap this size have won 48% in the backtest). Total: 4.8 pts above Vegas (50% historically).
Tale of the tape
BEAVER Stats, opponent-adjusted, entering the game. Rank among 32 NFL teams.Efficiency
+0.004 #14Offense EPA / play−0.079 #29
+0.042 #27Defense EPA / play allowed−0.107 #2
−0.1% #16Offense success rate−3.8% #31
+0.8% #24Defense success rate allowed−5.4% #1
−0.055 #22Passing EPA / dropback−0.093 #27
+0.051 #27Pass defense EPA allowed−0.146 #1
+0.104 #2Rushing EPA / carry−0.055 #23
+0.044 #27Rush defense EPA allowed−0.068 #3
−0.023 #20Early-down EPA (1st & 2nd)−0.061 #26
+0.056 #30Early-down EPA allowed−0.078 #1
Scoring and special teams
+1.7 #8Scoring offense (pts vs avg)−1.4 #25
+2.6 #29Scoring defense (pts vs avg)−4.8 #1
+0.23 #12Special teams EPA / game−0.32 #21
Touchdown scorers
▲ good matchup vs. his usual · full TD board Indianapolis Colts
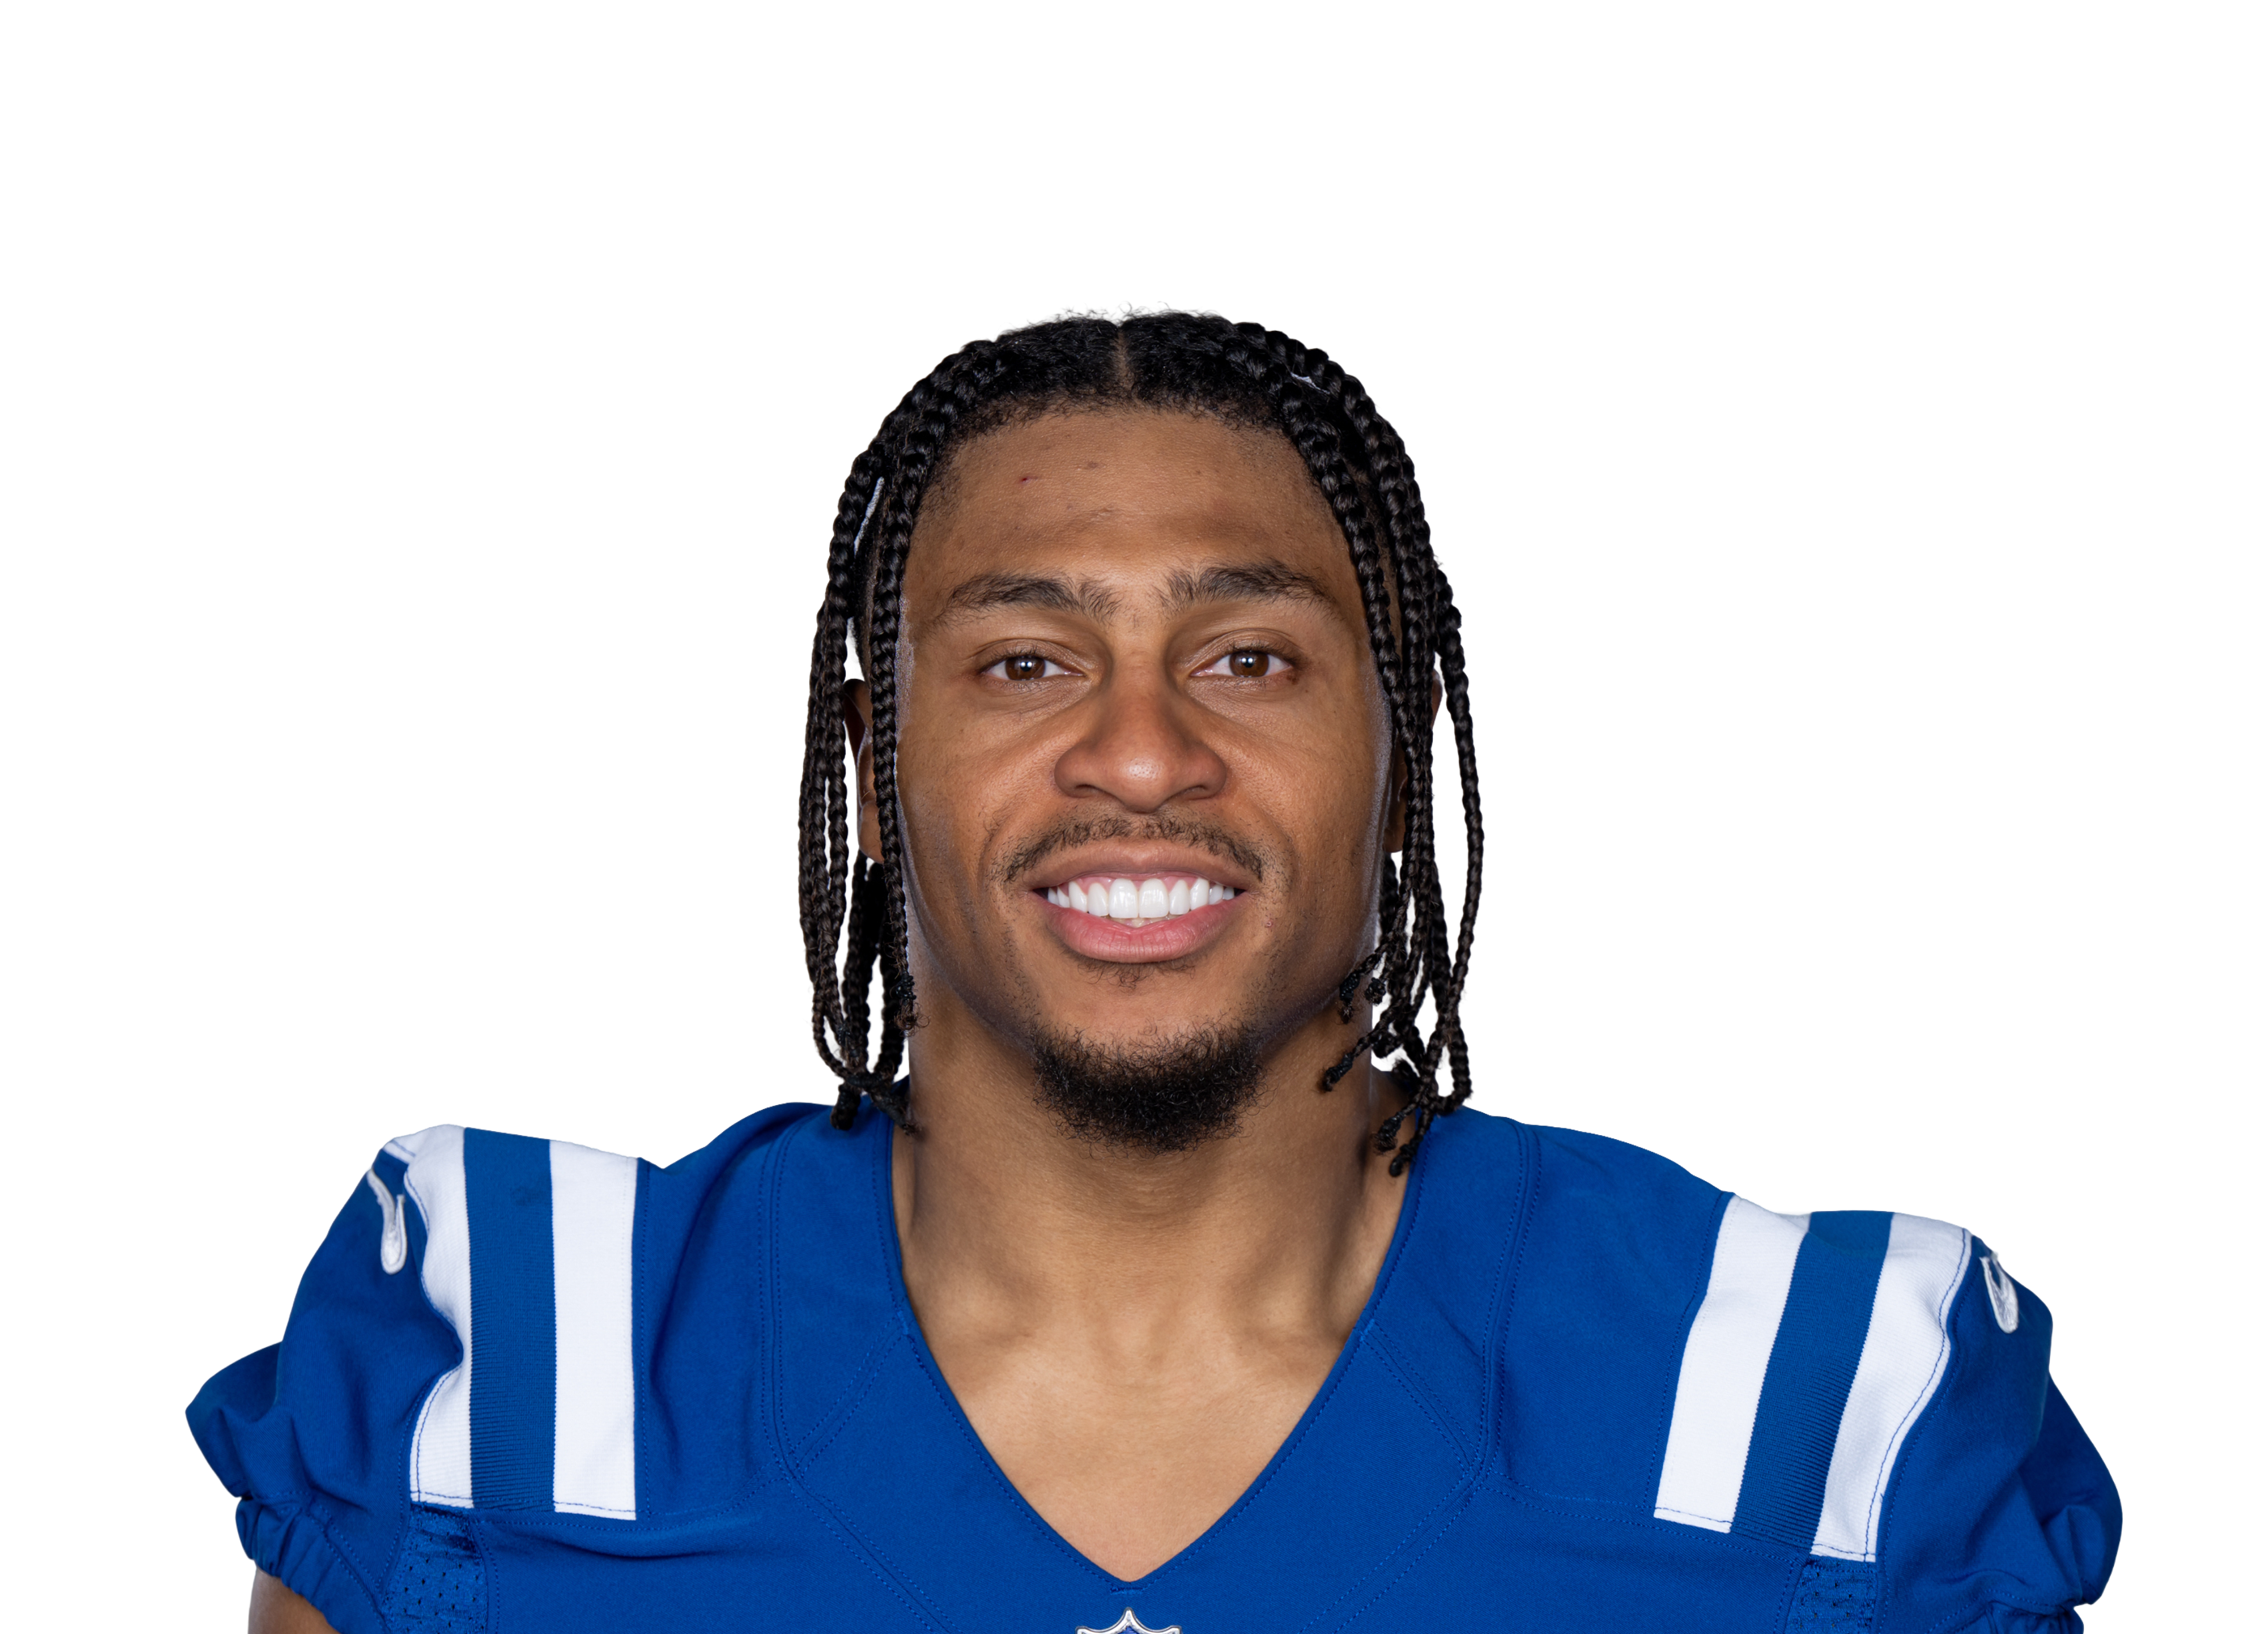
70% of the team's carries inside the 10 · Vegas has the Colts at about 18 points, 5 fewer than usual
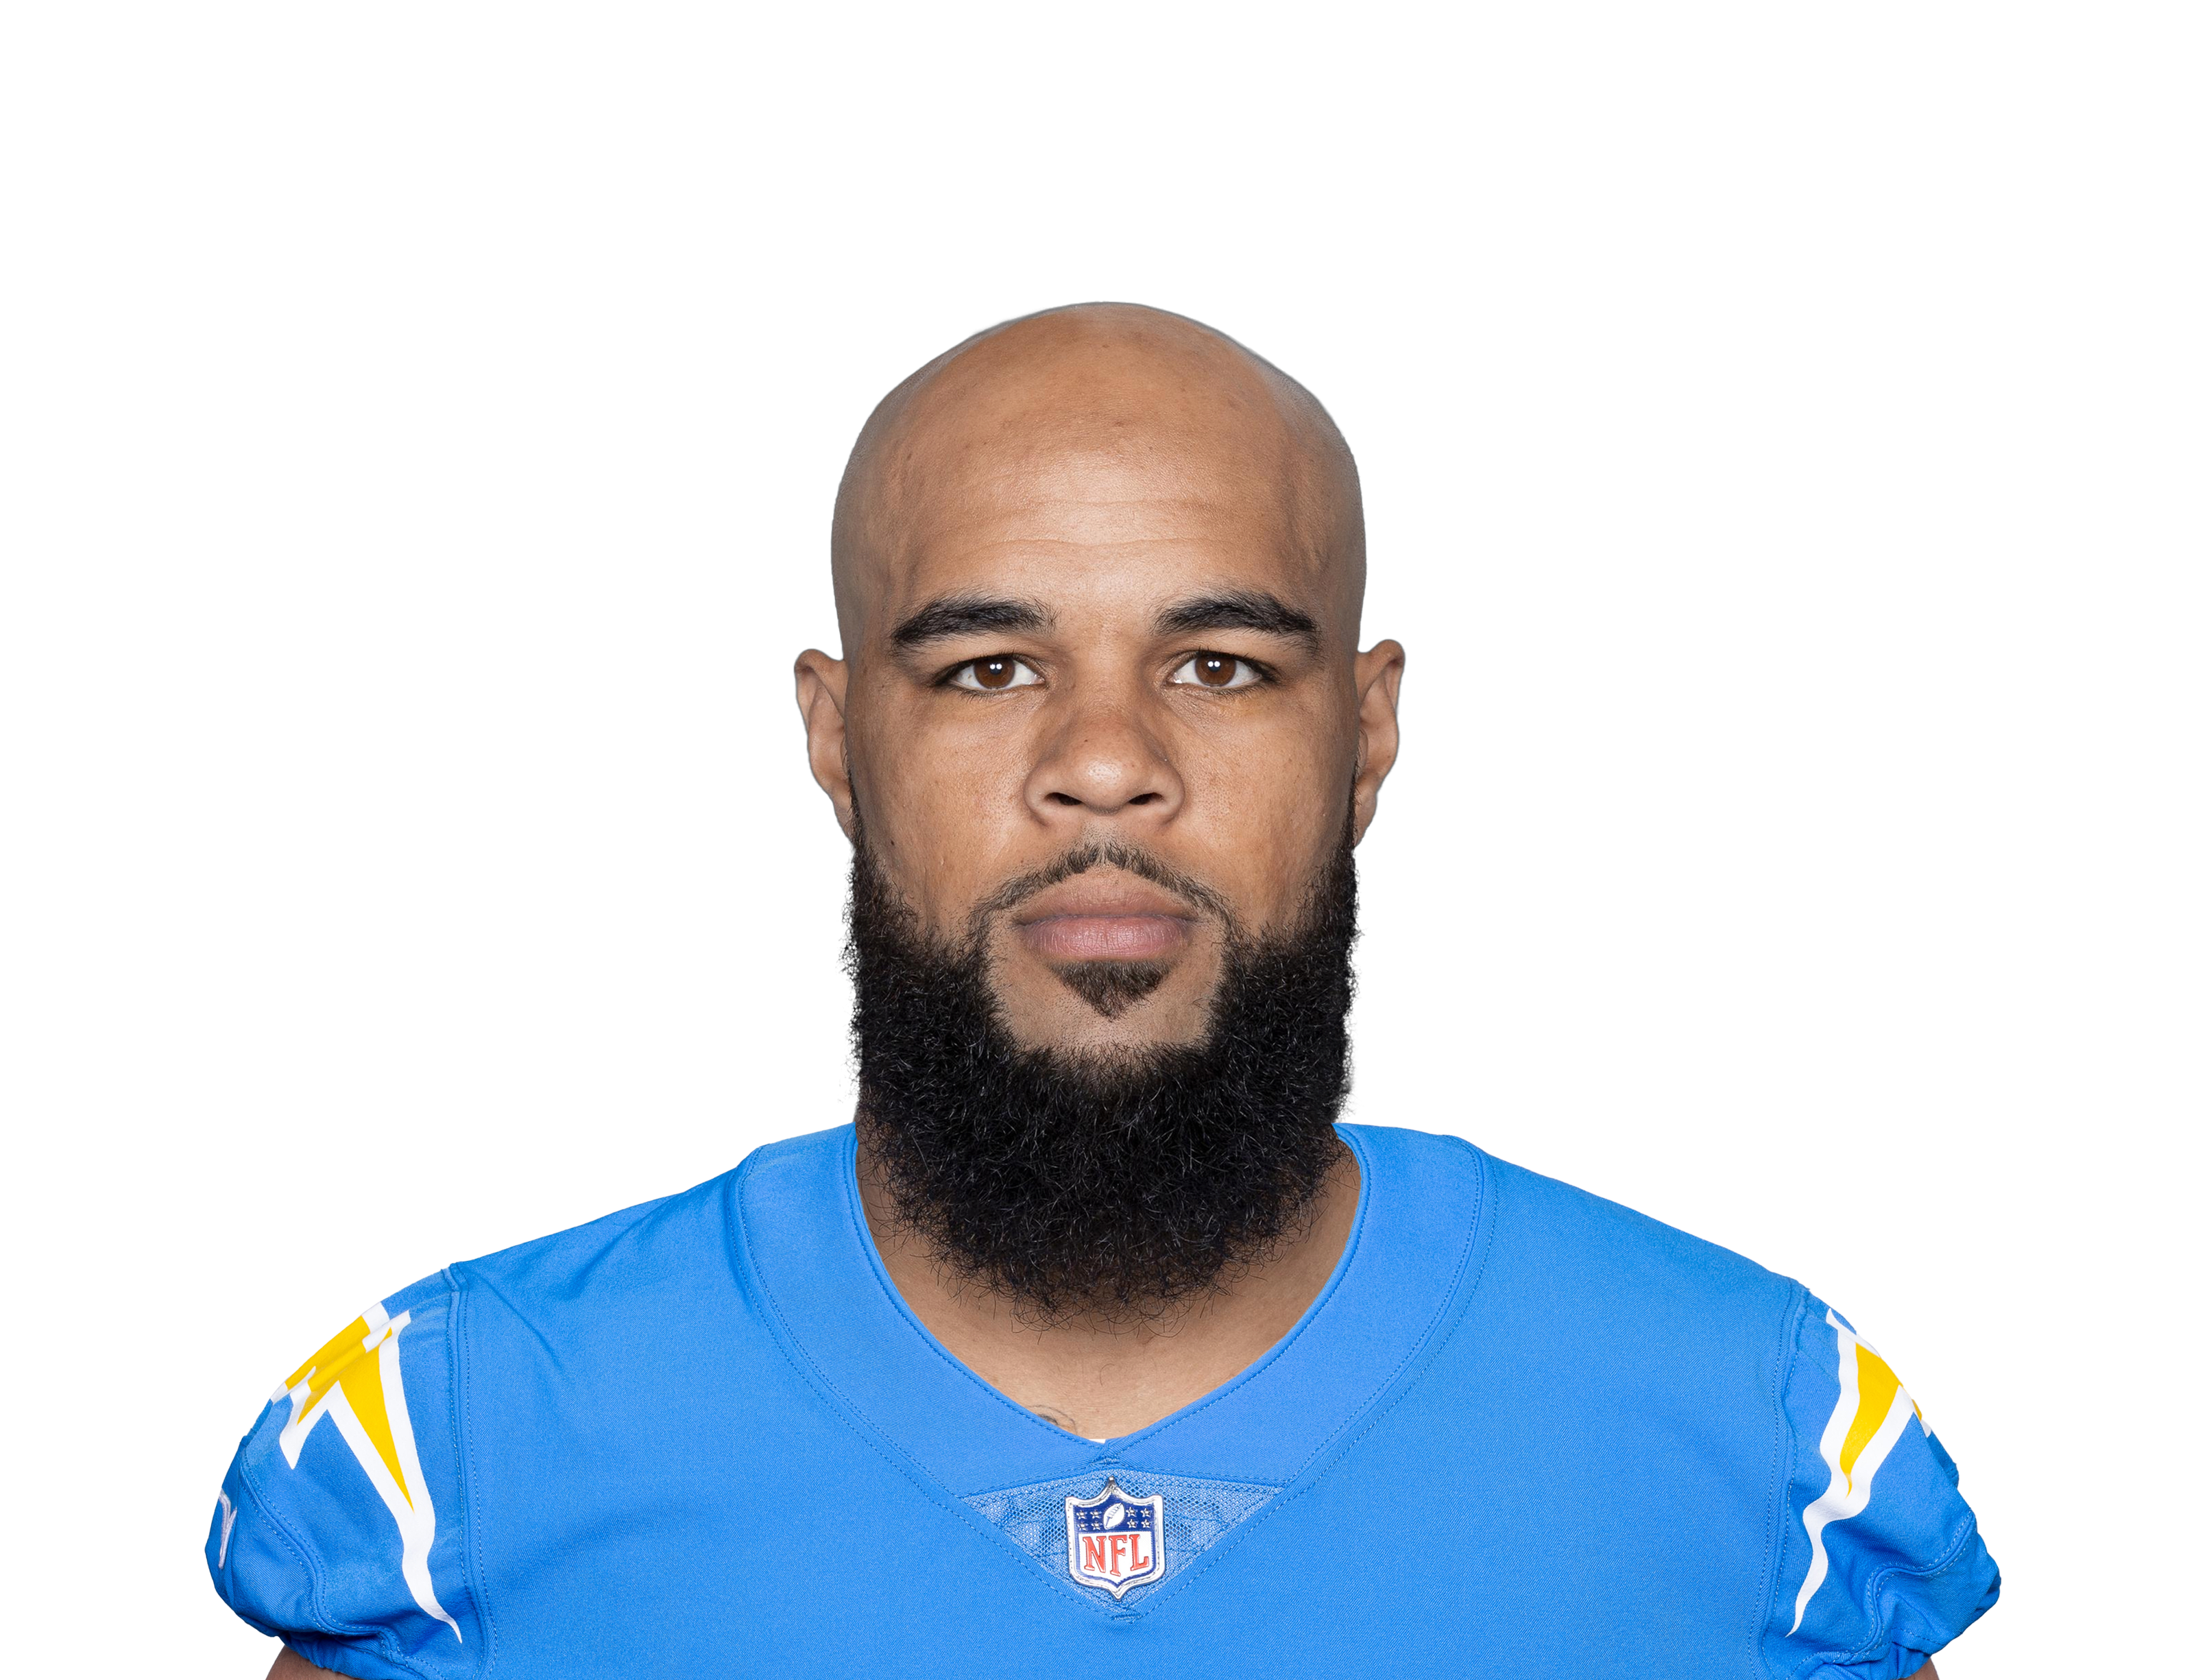
23% of the team's targets · Tough matchup: Vikings have allowed 0.5 TDs a game to receivers lately (average 0.9)

Tough matchup: Vikings have allowed 0.5 TDs a game to receivers lately (average 0.9) · Vegas has the Colts at about 18 points, 5 fewer than usual
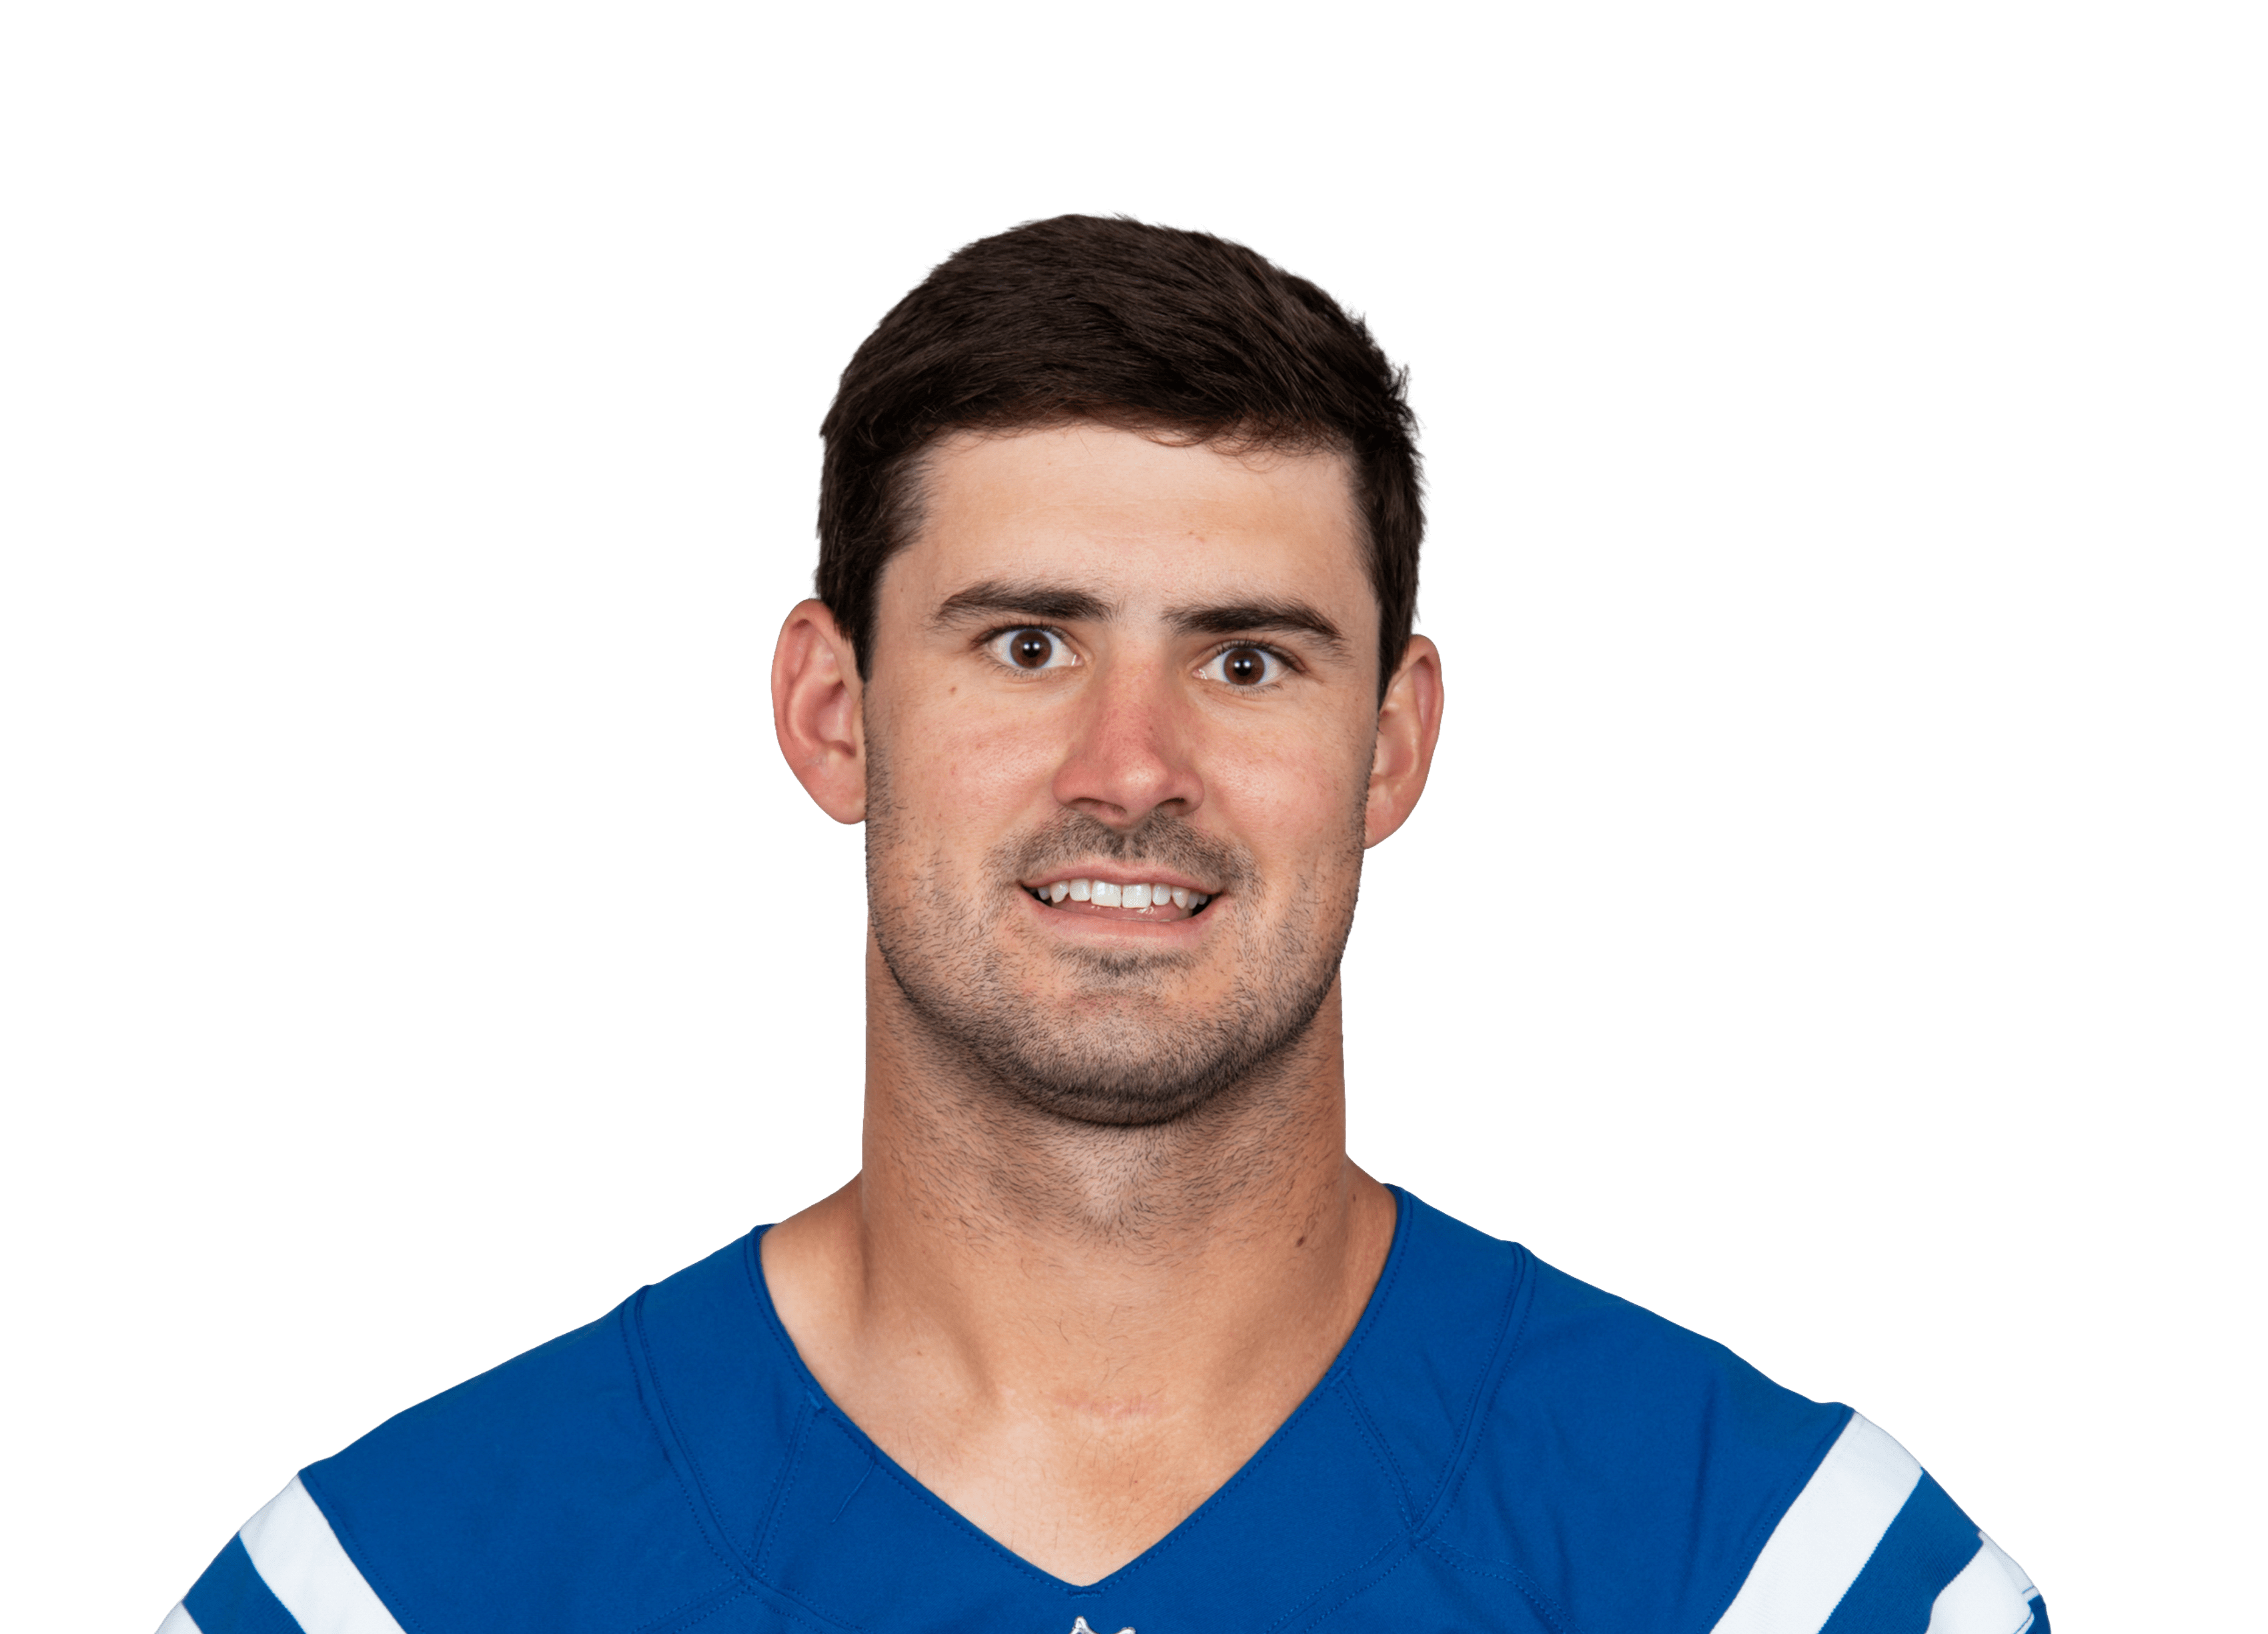
Vegas has the Colts at about 18 points, 5 fewer than usual
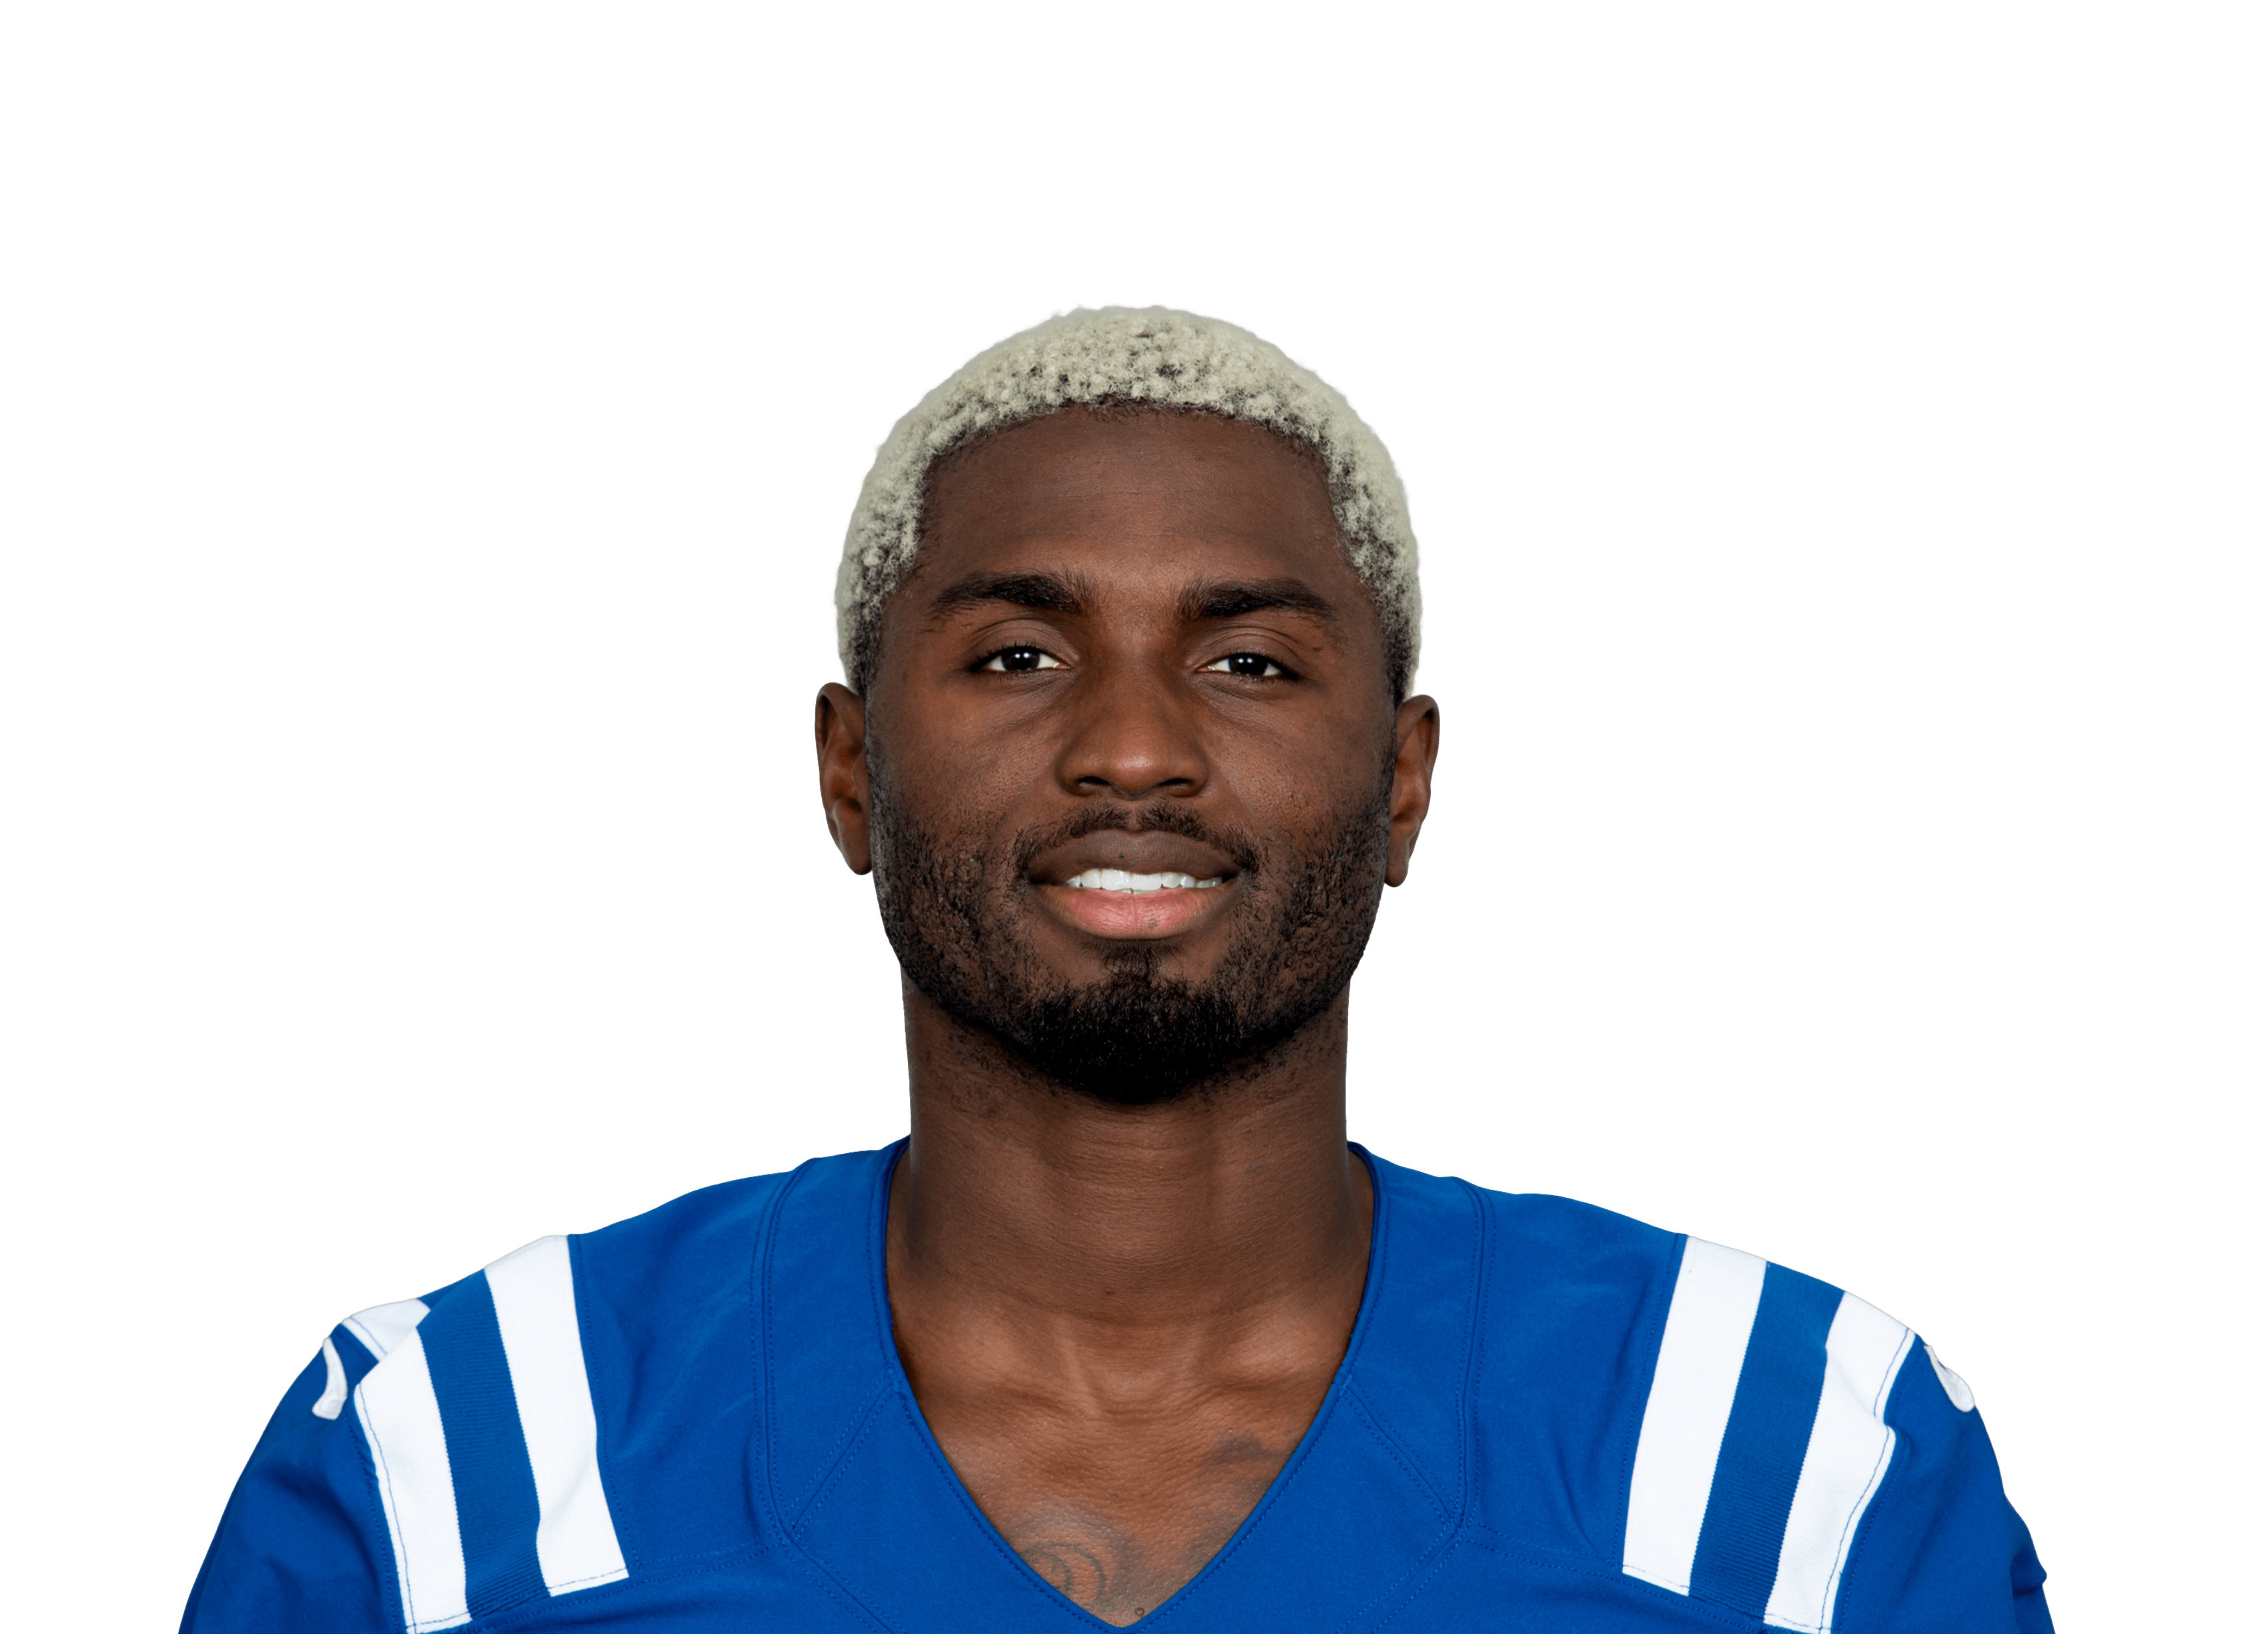
Tough matchup: Vikings have allowed 0.5 TDs a game to receivers lately (average 0.9) · Vegas has the Colts at about 18 points, 5 fewer than usual
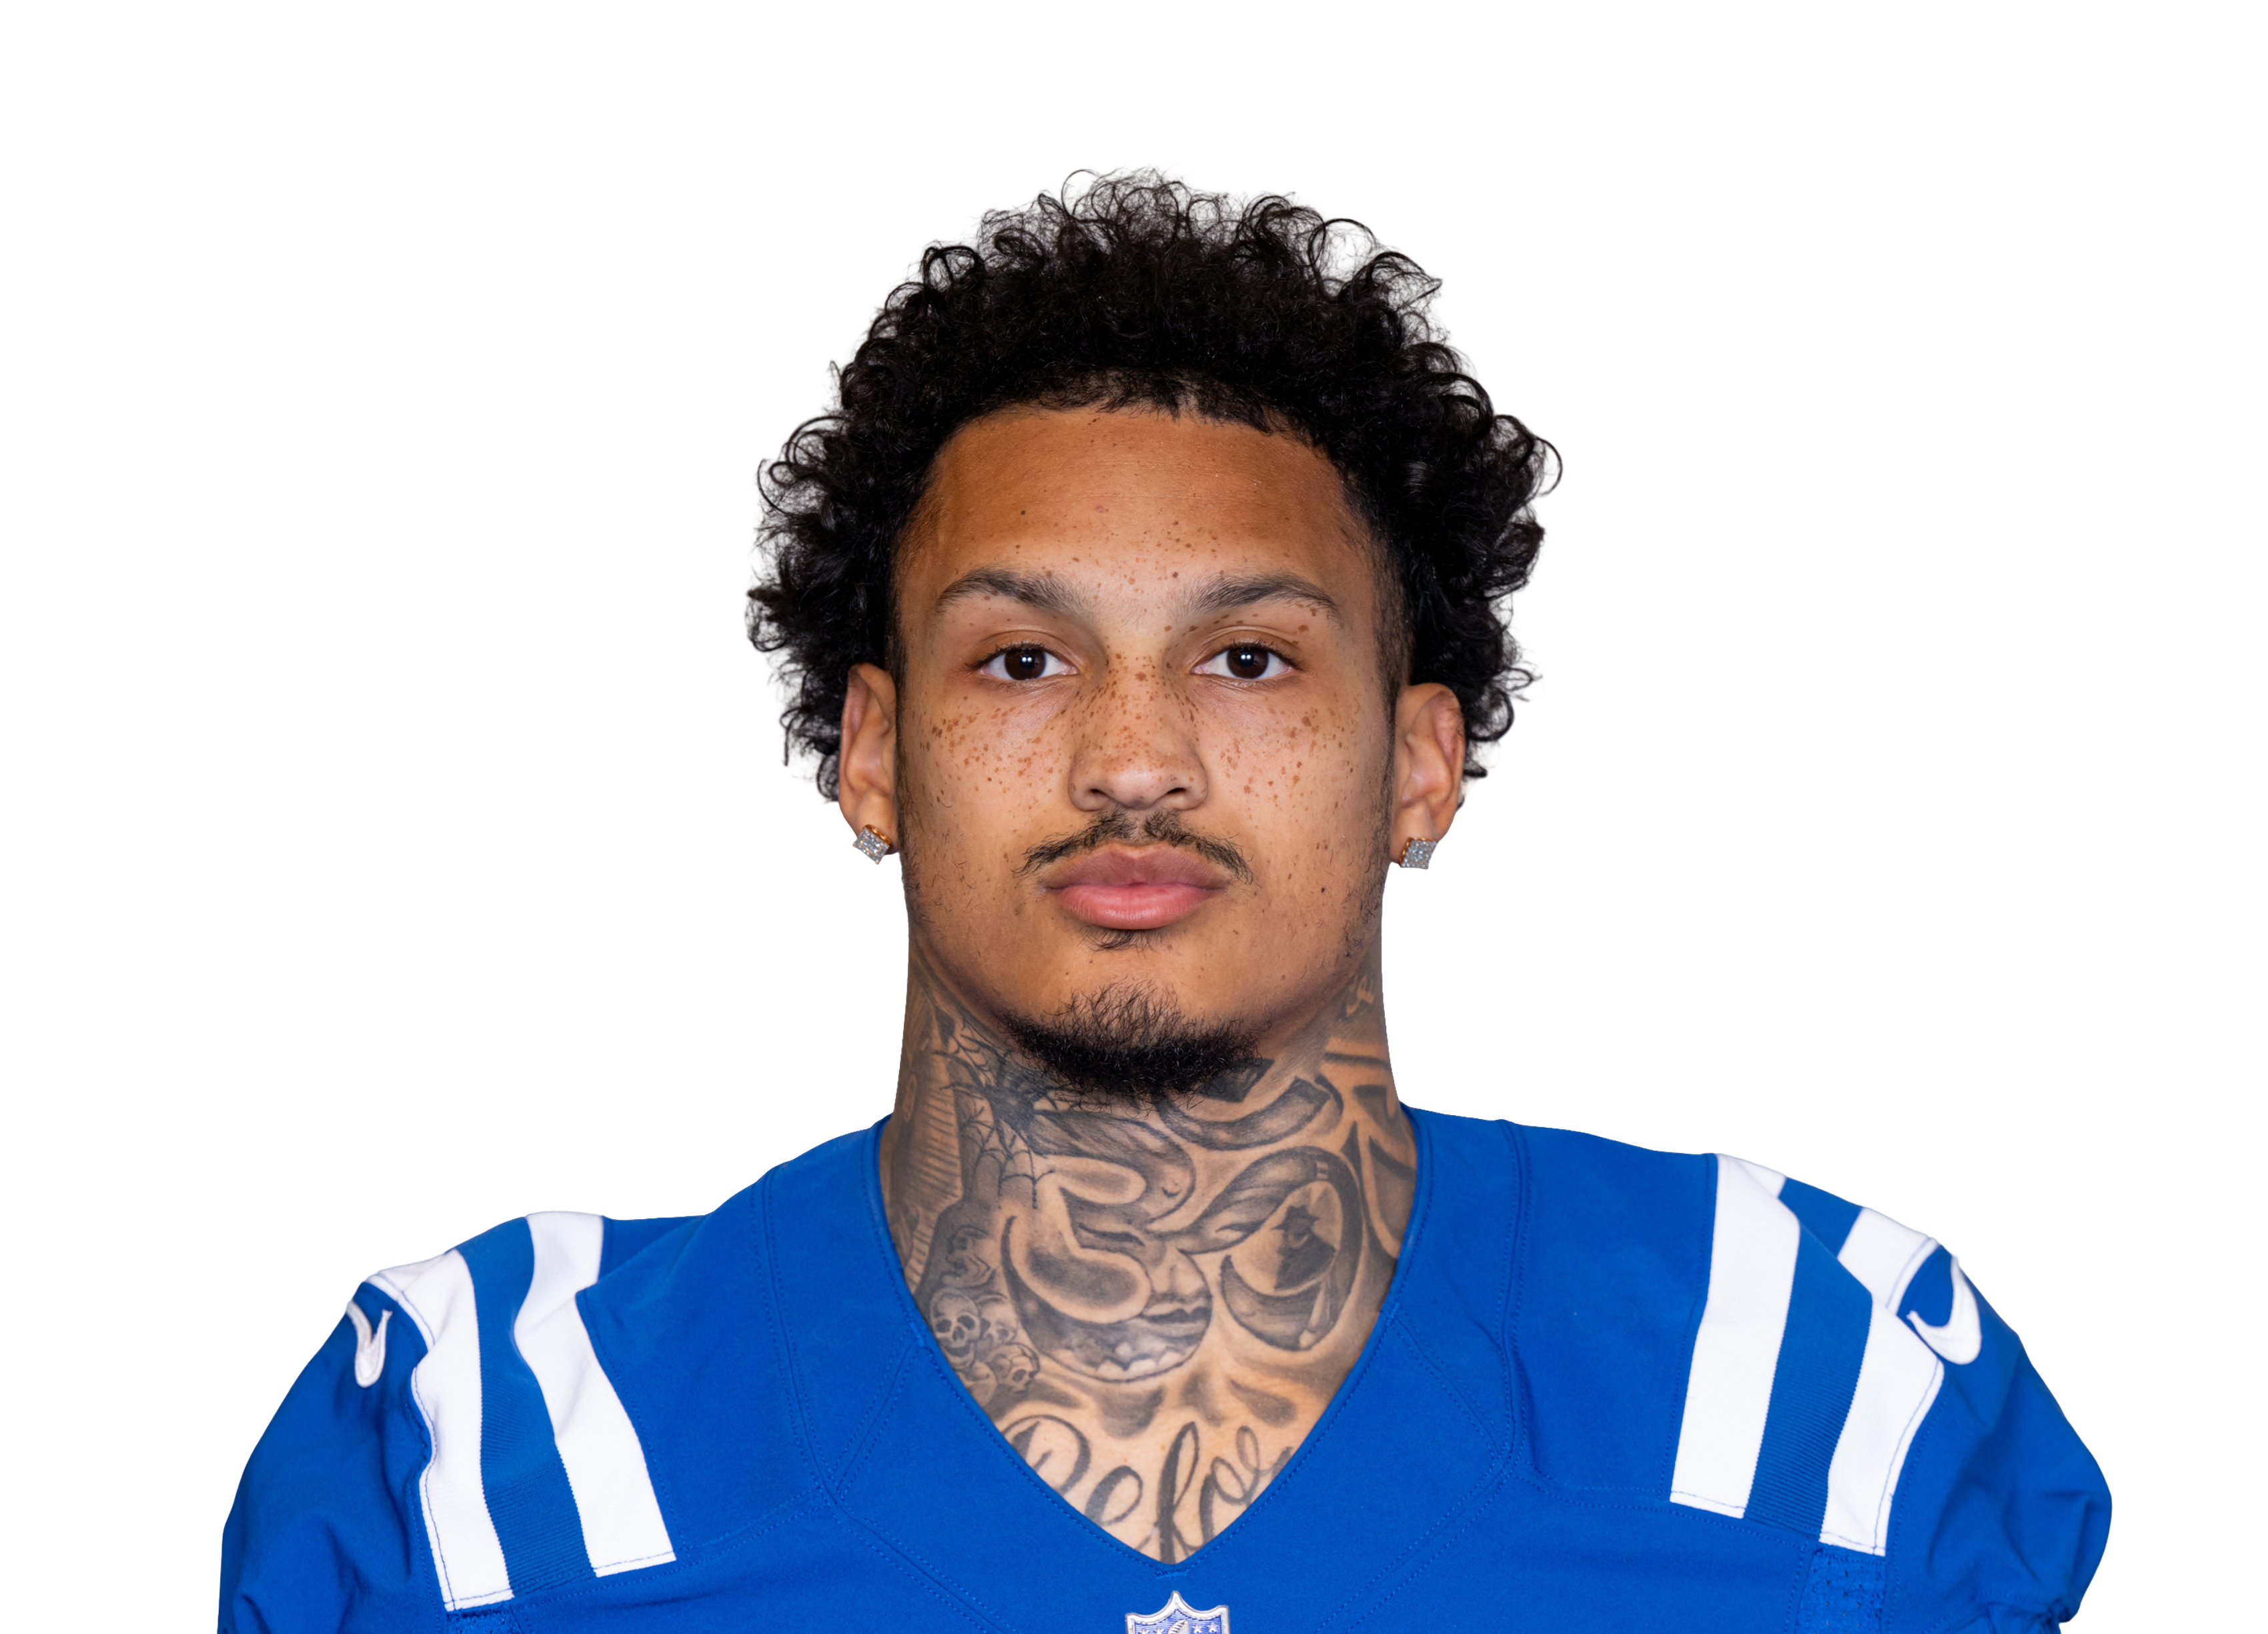
Vegas has the Colts at about 18 points, 5 fewer than usual
 Minnesota Vikings
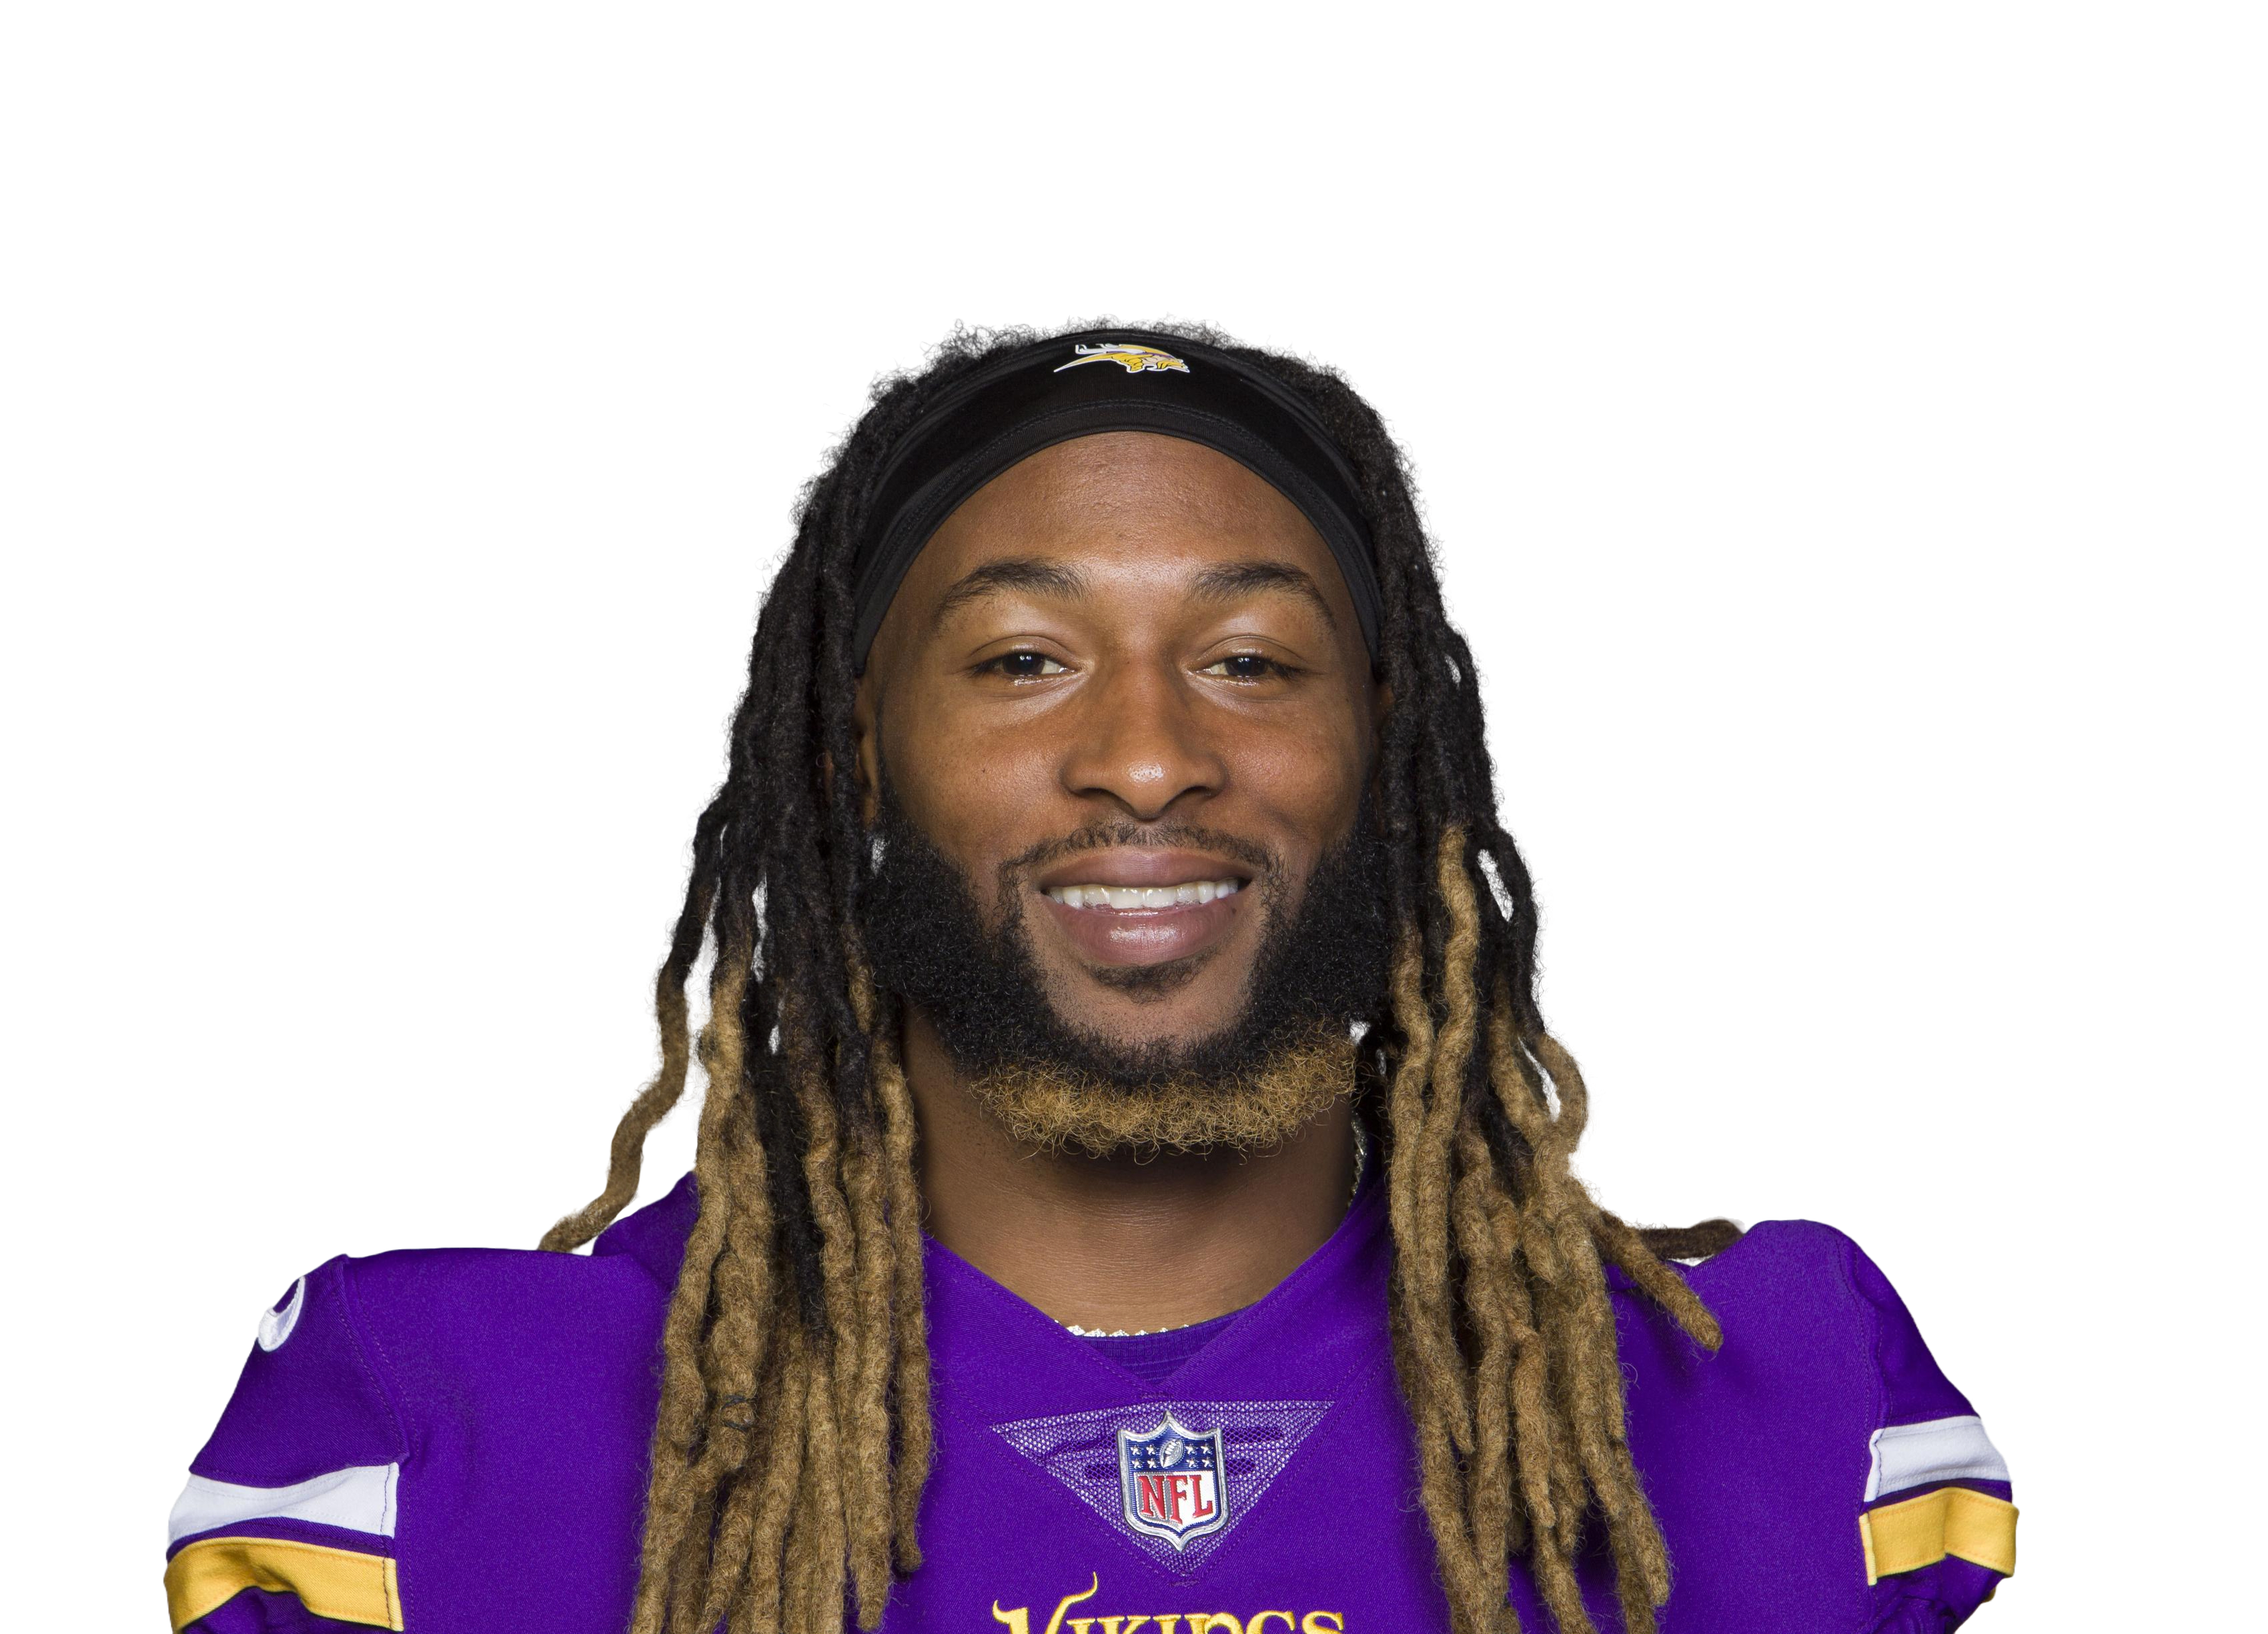
62% of the team's carries inside the 10
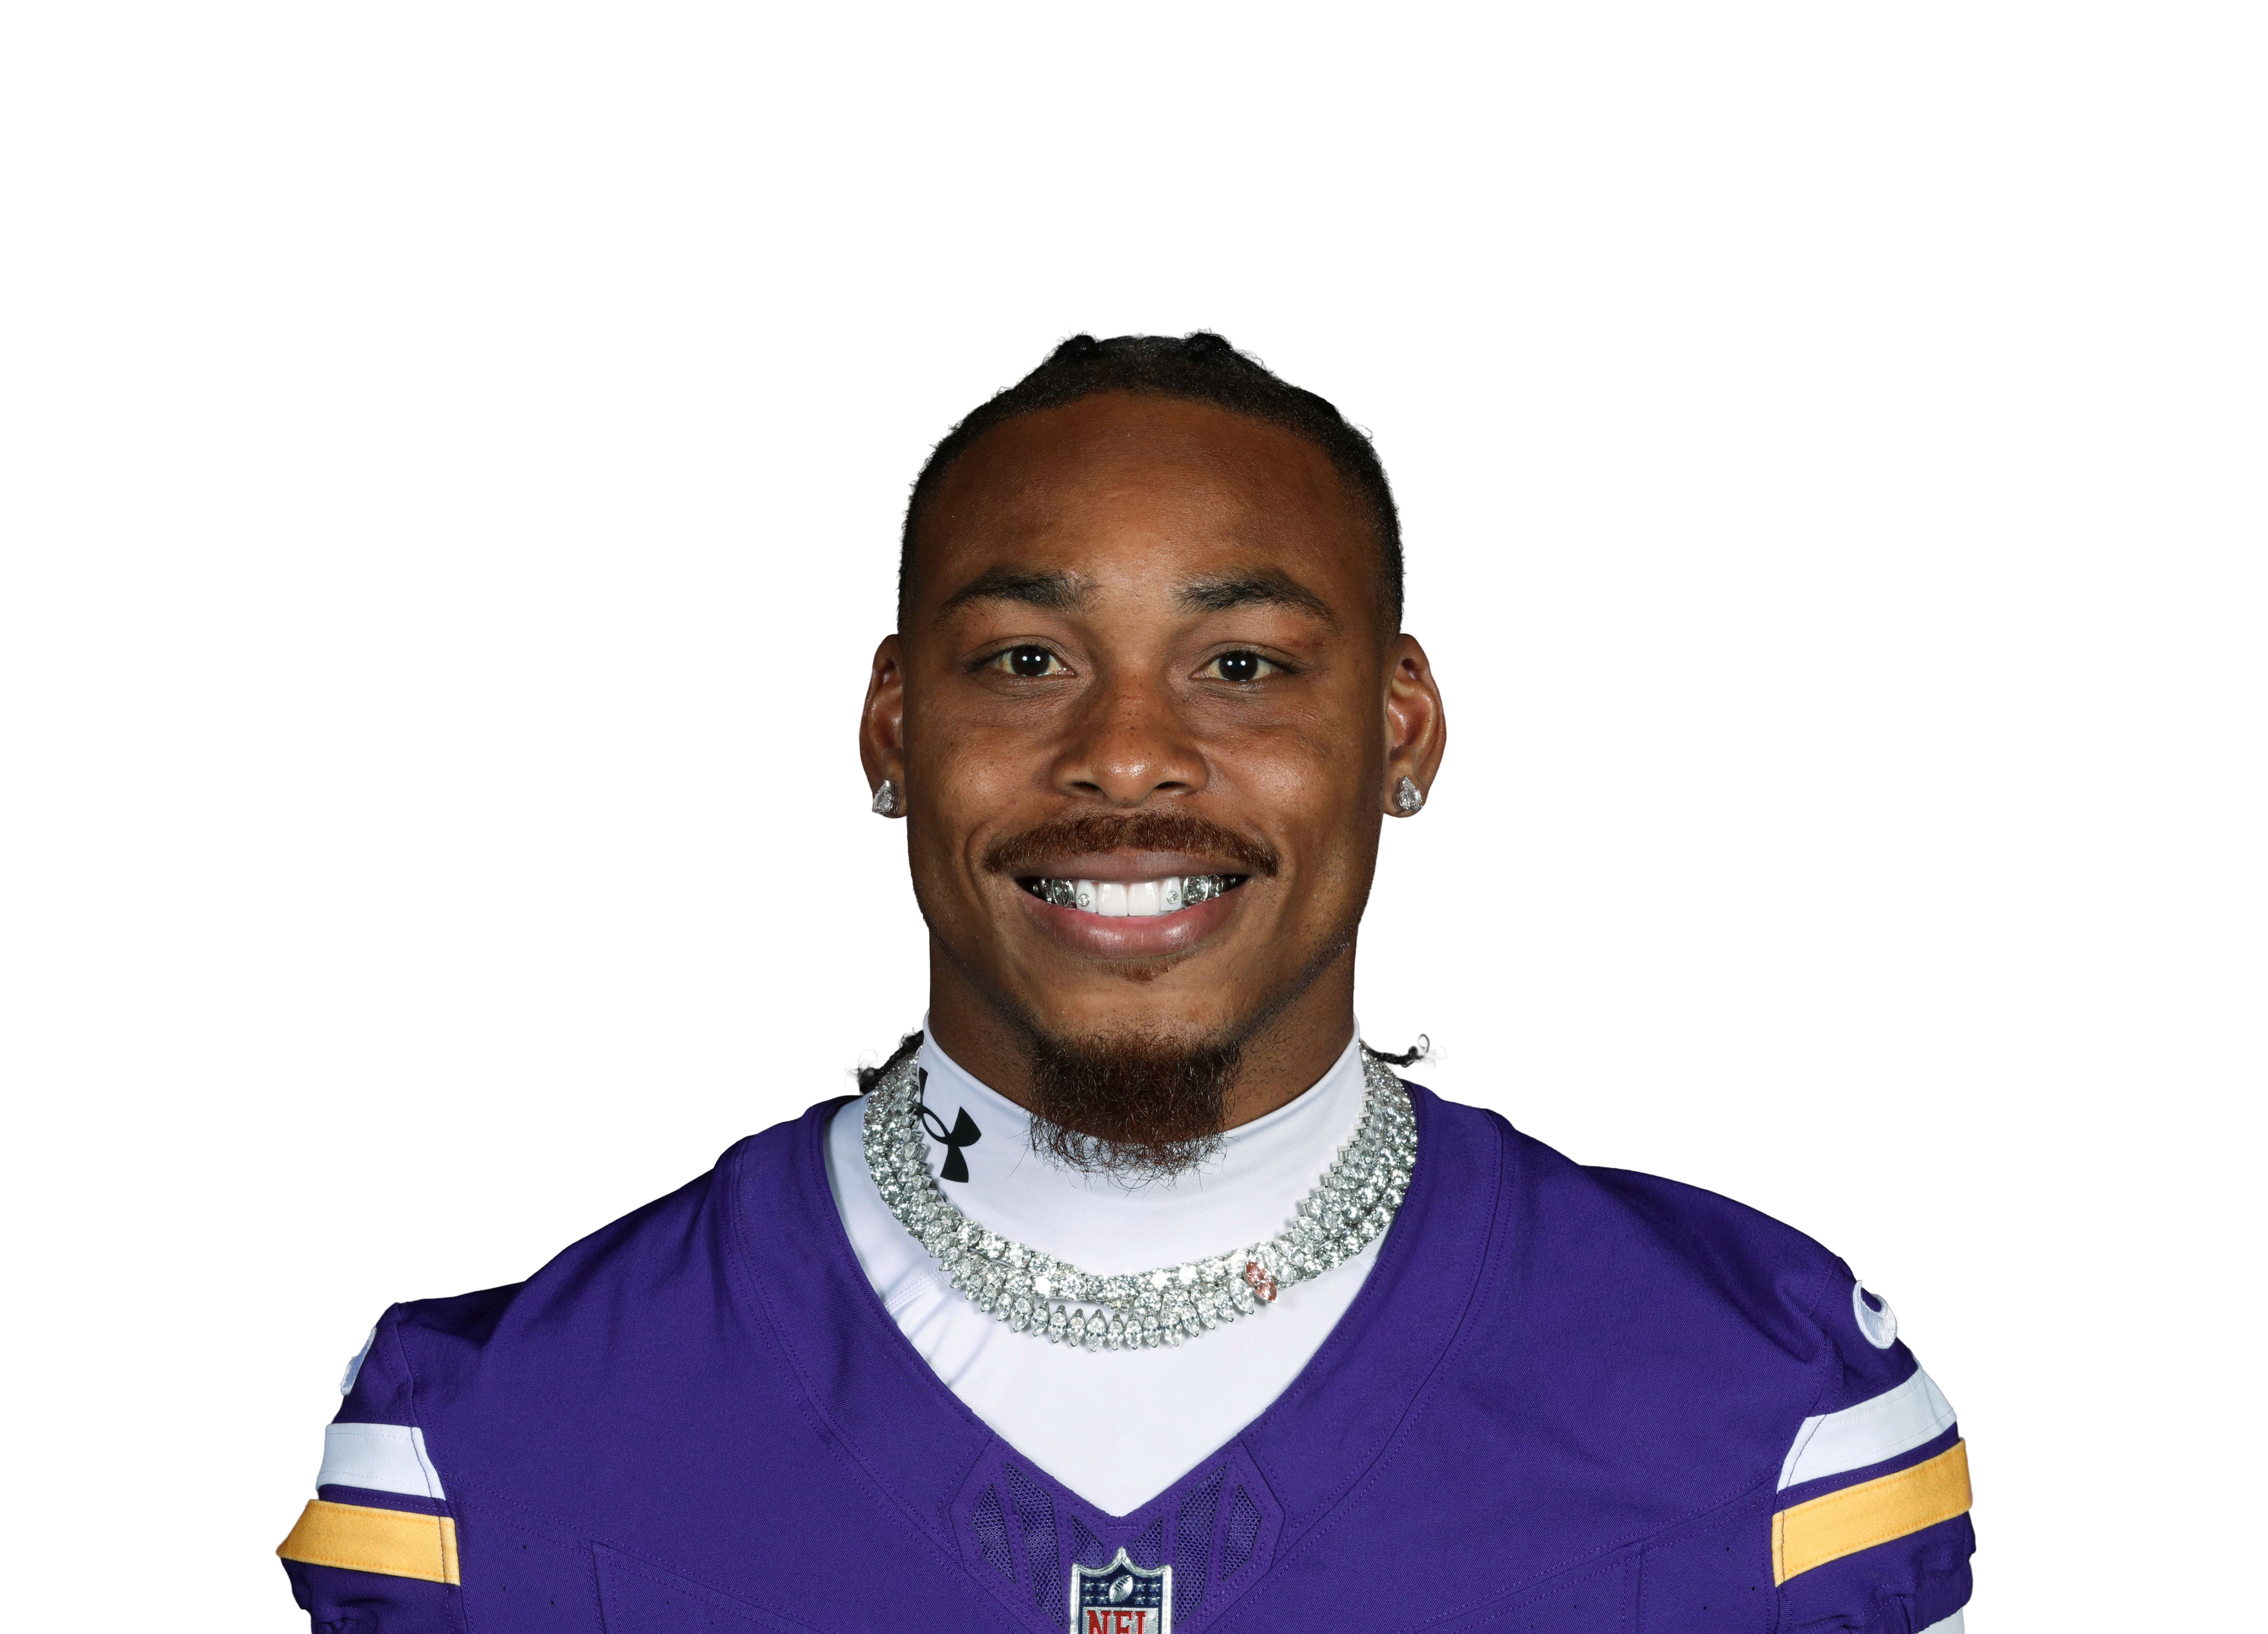
49% of the team's end-zone targets
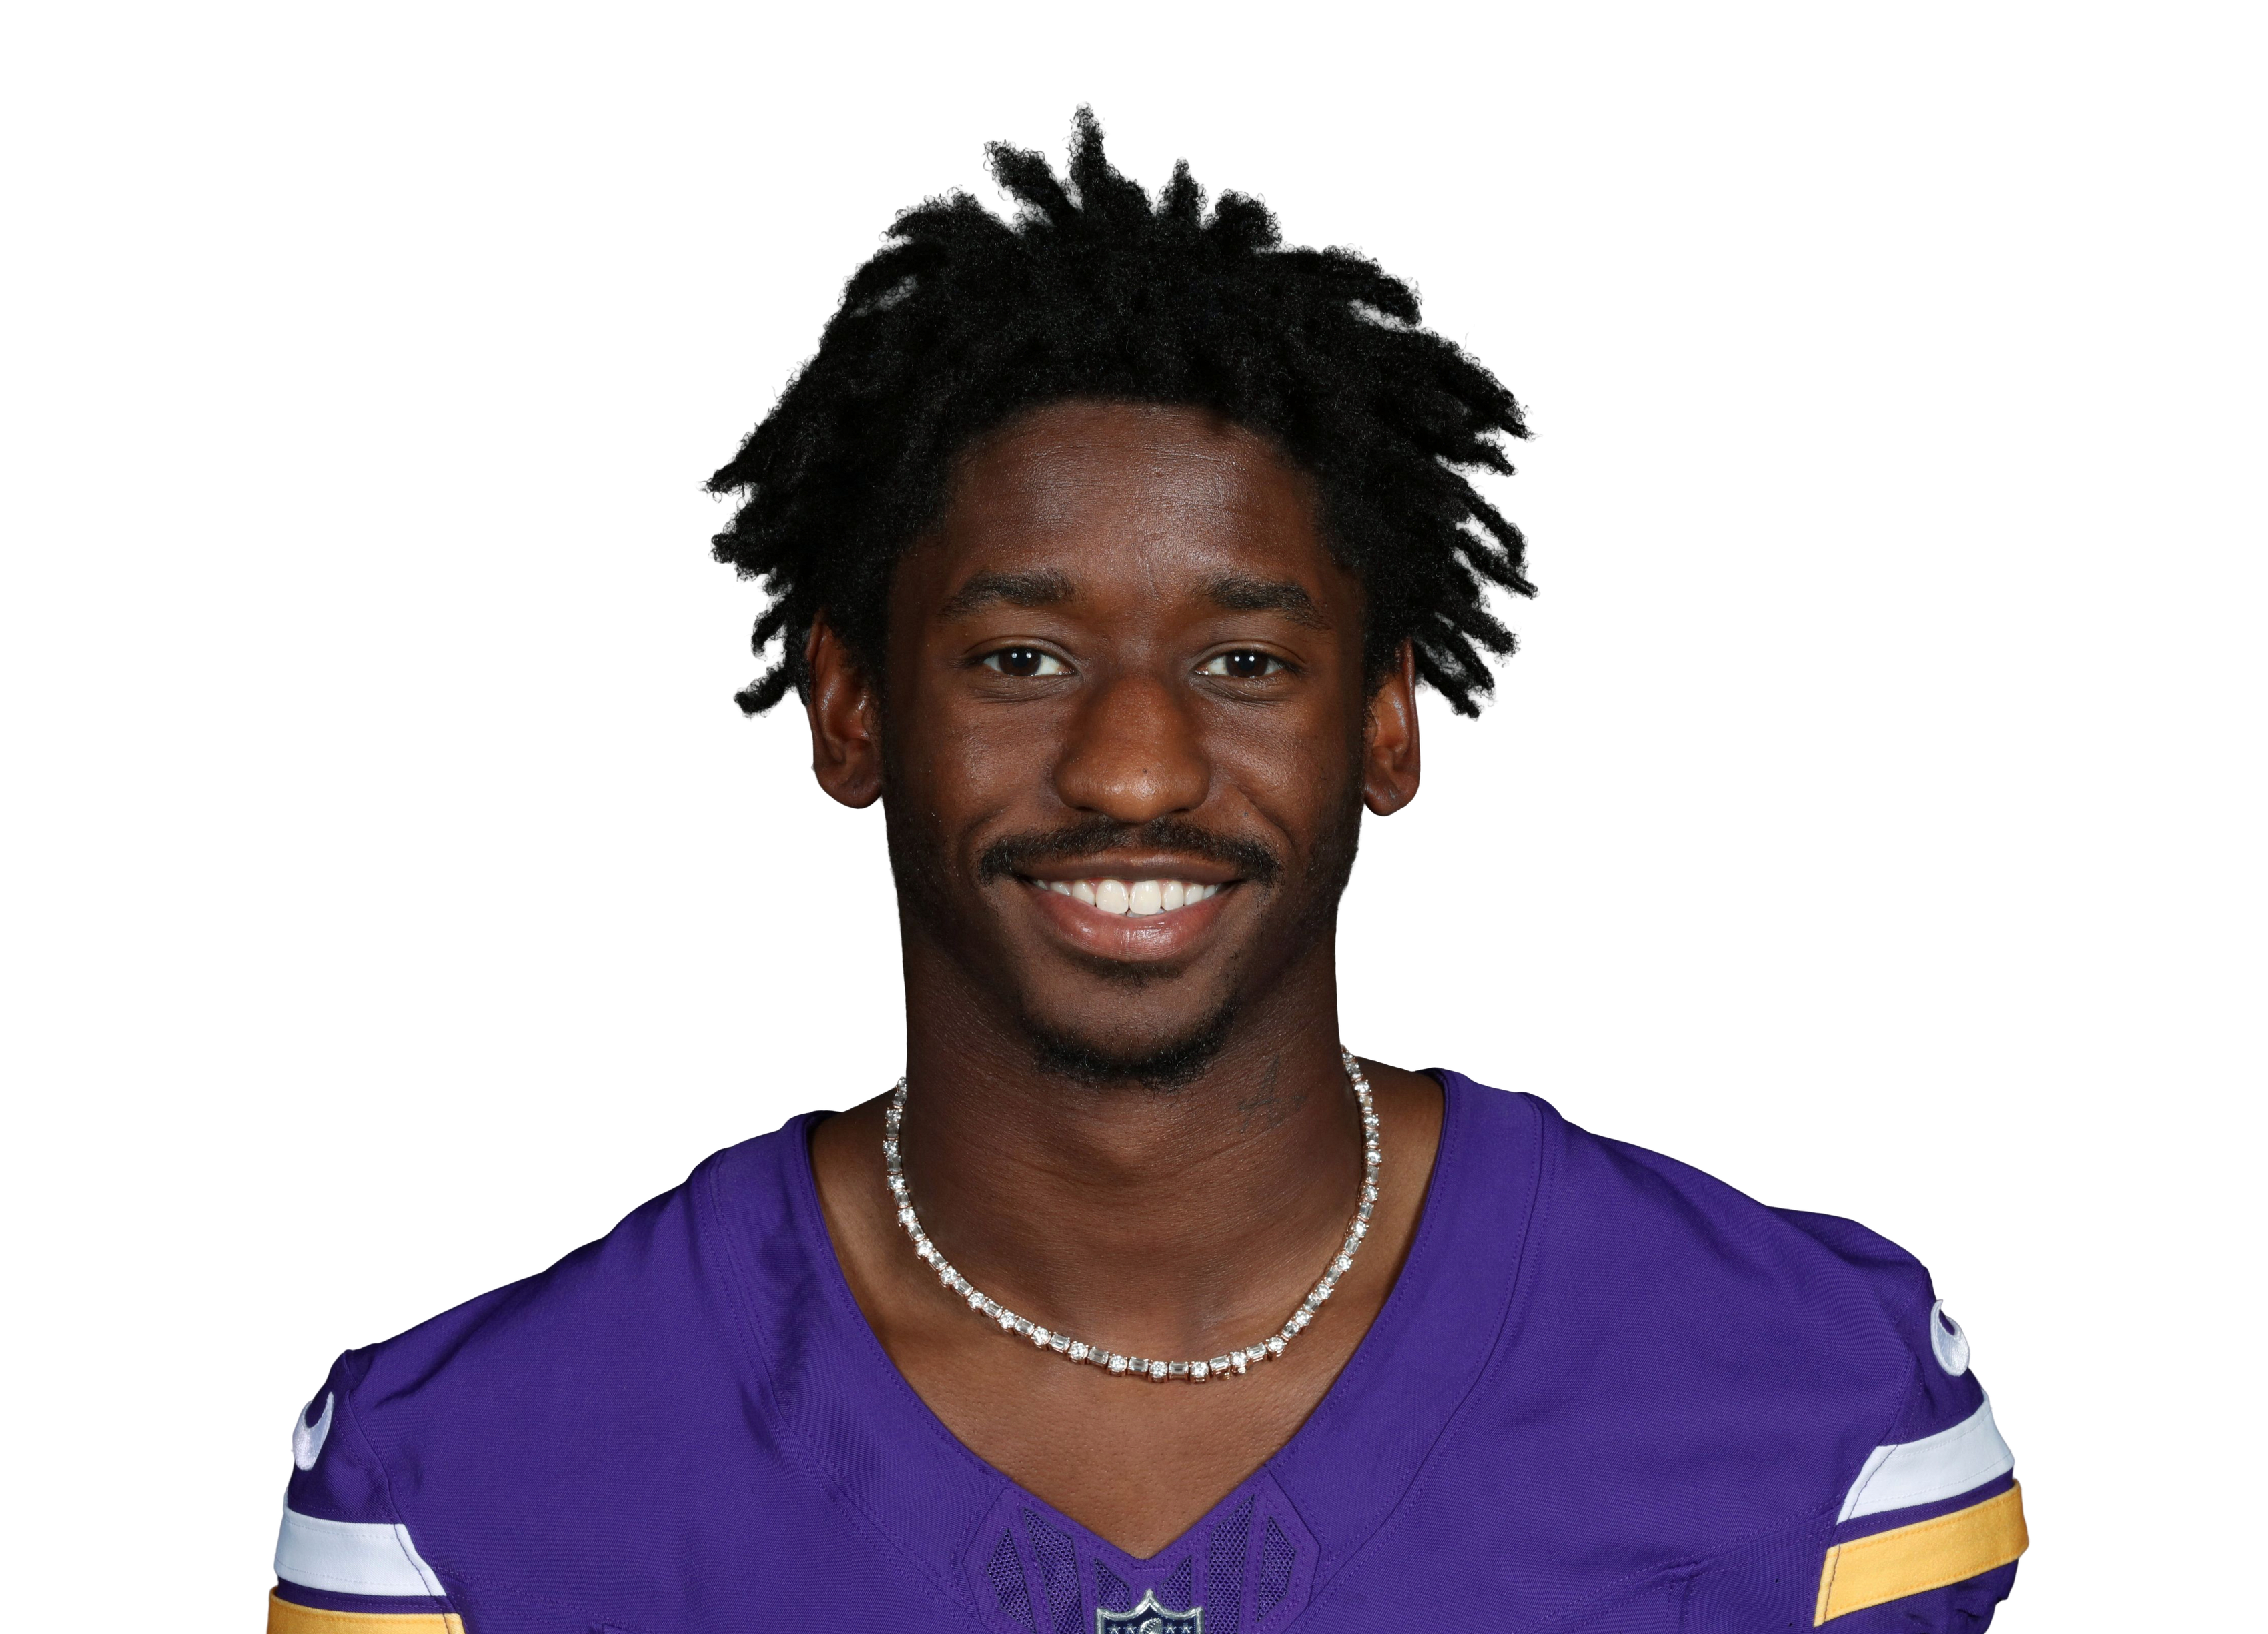
27% of the team's end-zone targets
30% of the team's end-zone targets
Several smaller matchup factors add up: Colts' defensive ratings and red-zone chances allowed lately
Player projections
typical game, with the likely range (middle half of outcomes); after the game the actual stat is shown · ▲ 5%+ above his usual · all player props| Indianapolis Colts | |||
|---|---|---|---|
| Passing | Yds | ||
| Daniel Jones QB | 190108 | ||
| Rushing | Yds | ||
| Jonathan Taylor RB | 7195 | ||
| Seth McGowan RB | 1146 | ||
| Daniel Jones QB | 813 | ||
| Receiving | Rec | Yds | |
| Keenan Allen WR | 4.03 | 3931 | |
| Josh Downs WR | 3.62 | 3818 | |
| Laquon Treadwell WR | 1.52 | 1919 | |
| Jonathan Taylor RB | 2.62 | 1715 | |
| Will Mallory TE | 1.00 | 100 | |
| Minnesota Vikings | |||
|---|---|---|---|
| Passing | Yds | ||
| Kyler Murray QB | 214150 | ||
| Rushing | Yds | ||
| Aaron Jones RB | 6226 | ||
| Kyler Murray QB | 2239 | ||
| Demond Claiborne RB | 3DNP | ||
| Receiving | Rec | Yds | |
| Justin Jefferson WR | 4.54 | 5644 | |
| Jordan Addison WR | 3.12 | 4020 | |
| Jauan Jennings WR | 1.62 | 1934 | |
| T.J. Hockenson TE | 2.74 | 1935 | |
| Aaron Jones RB | 2.71 | 170 | |
Quarterbacks
career EPA per dropback (league average is about 0; older seasons count less)STARTED · Colts
Daniel Jones
EPA per dropback −0.04
STARTED · Vikings
Kyler Murray
EPA per dropback −0.01
Injury report
players listed Out, Doubtful or Questionable this week| Indianapolis Colts | ||
|---|---|---|
| Anthony Gould | WR · Concussion | Out |
| Tyler Warren | TE · Groin | Out |
| CJ Allen | LB · Ankle | Out |
| Sauce Gardner | CB · Calf | Out |
| Bryce Boettcher | LB · Groin | Questionable |
| Justin Walley | CB · Knee | Questionable |
| Minnesota Vikings | ||
|---|---|---|
| Jordan Mason | RB · Thumb | Questionable |
Colts: last 5 games
| L20-26 | Missed | |
| L22-34 | Missed | |
| W30-13 | Covered | |
| W19-17 | Covered | |
| L30-33 | Covered |





Vikings: last 5 games
| W23-13 | Covered | |
| W15-10 | Missed | |
| W23-16 | Covered | |
| W9-3 | Covered | |
| W39-22 | Covered |





Rating trend
BEAVER Stats: net EPA per play against an average team, entering each weekINDMIN
Loading the thread…
No box score for this game yet.
Closing lines
the last line before kickoff| Book | Spread | Total | Moneyline |
|---|---|---|---|
| Consensus | MIN −6.5 | 41.5 | IND +260 · MIN −325 |
| BEAVER fair line | MIN −7.3 | 46.3 | IND +245 · MIN −245 |
Loading…
Tendencies
Season to date. Against the spread and over/under use closing lines.| IND | MIN | |
|---|---|---|
| 2-5 | Record | 6-0 |
| 1-2 | Home | 3-0 |
| 1-3 | Away | 3-0 |
| 4-3 | Against the spread | 4-2 |
| 4-3 | Over/under | 1-5 |
| 22.0 / 25.7 | Points for / against | 20.8 / 12.3 |
| -3.7 | Avg margin | +8.5 |