NFL scores › Week 7 › Cowboys at Eagles
BEAVER PHI +4.5, lostBEAVER Under 43.5, lostBEAVER had DAL 54% to win
BEAVER against the market
Locked at kickoff, graded on the closing line| BEAVER | Market | Result | Call | |
|---|---|---|---|---|
| Score (DAL–PHI) | 22–21 | – | 38–21 | |
| Spread | DAL −1.3 | DAL −4.5 | DAL by 17 | PHI +4.5 ✗ |
| Total | 42.7 | 43.5 | 59 | Under 43.5 ✗ |
| PHI win chance | 46% | +185 | Lost |
DAL by 8+
31%
DAL by 1–7
23%
PHI by 1–7
22%
PHI by 8+
24%
Spread: 3.2 pts better than Vegas for Eagles (sides with a gap this size have won 51% in the backtest). Total: 0.8 pts below Vegas (50% historically).
Tale of the tape
BEAVER Stats, opponent-adjusted, entering the game. Rank among 32 NFL teams.Efficiency
+0.054 #10Offense EPA / play−0.058 #26
+0.134 #32Defense EPA / play allowed−0.030 #7
+2.2% #11Offense success rate−3.8% #30
+4.7% #32Defense success rate allowed−1.4% #6
+0.060 #9Passing EPA / dropback−0.063 #23
+0.197 #32Pass defense EPA allowed−0.037 #8
+0.037 #12Rushing EPA / carry−0.054 #22
+0.076 #31Rush defense EPA allowed−0.018 #12
+0.054 #9Early-down EPA (1st & 2nd)−0.066 #28
+0.103 #32Early-down EPA allowed−0.045 #4
Scoring and special teams
+1.9 #7Scoring offense (pts vs avg)−2.4 #27
+3.6 #32Scoring defense (pts vs avg)−1.4 #9
+0.04 #17Special teams EPA / game+0.34 #9
Touchdown scorers
▲ good matchup vs. his usual · full TD board Dallas Cowboys
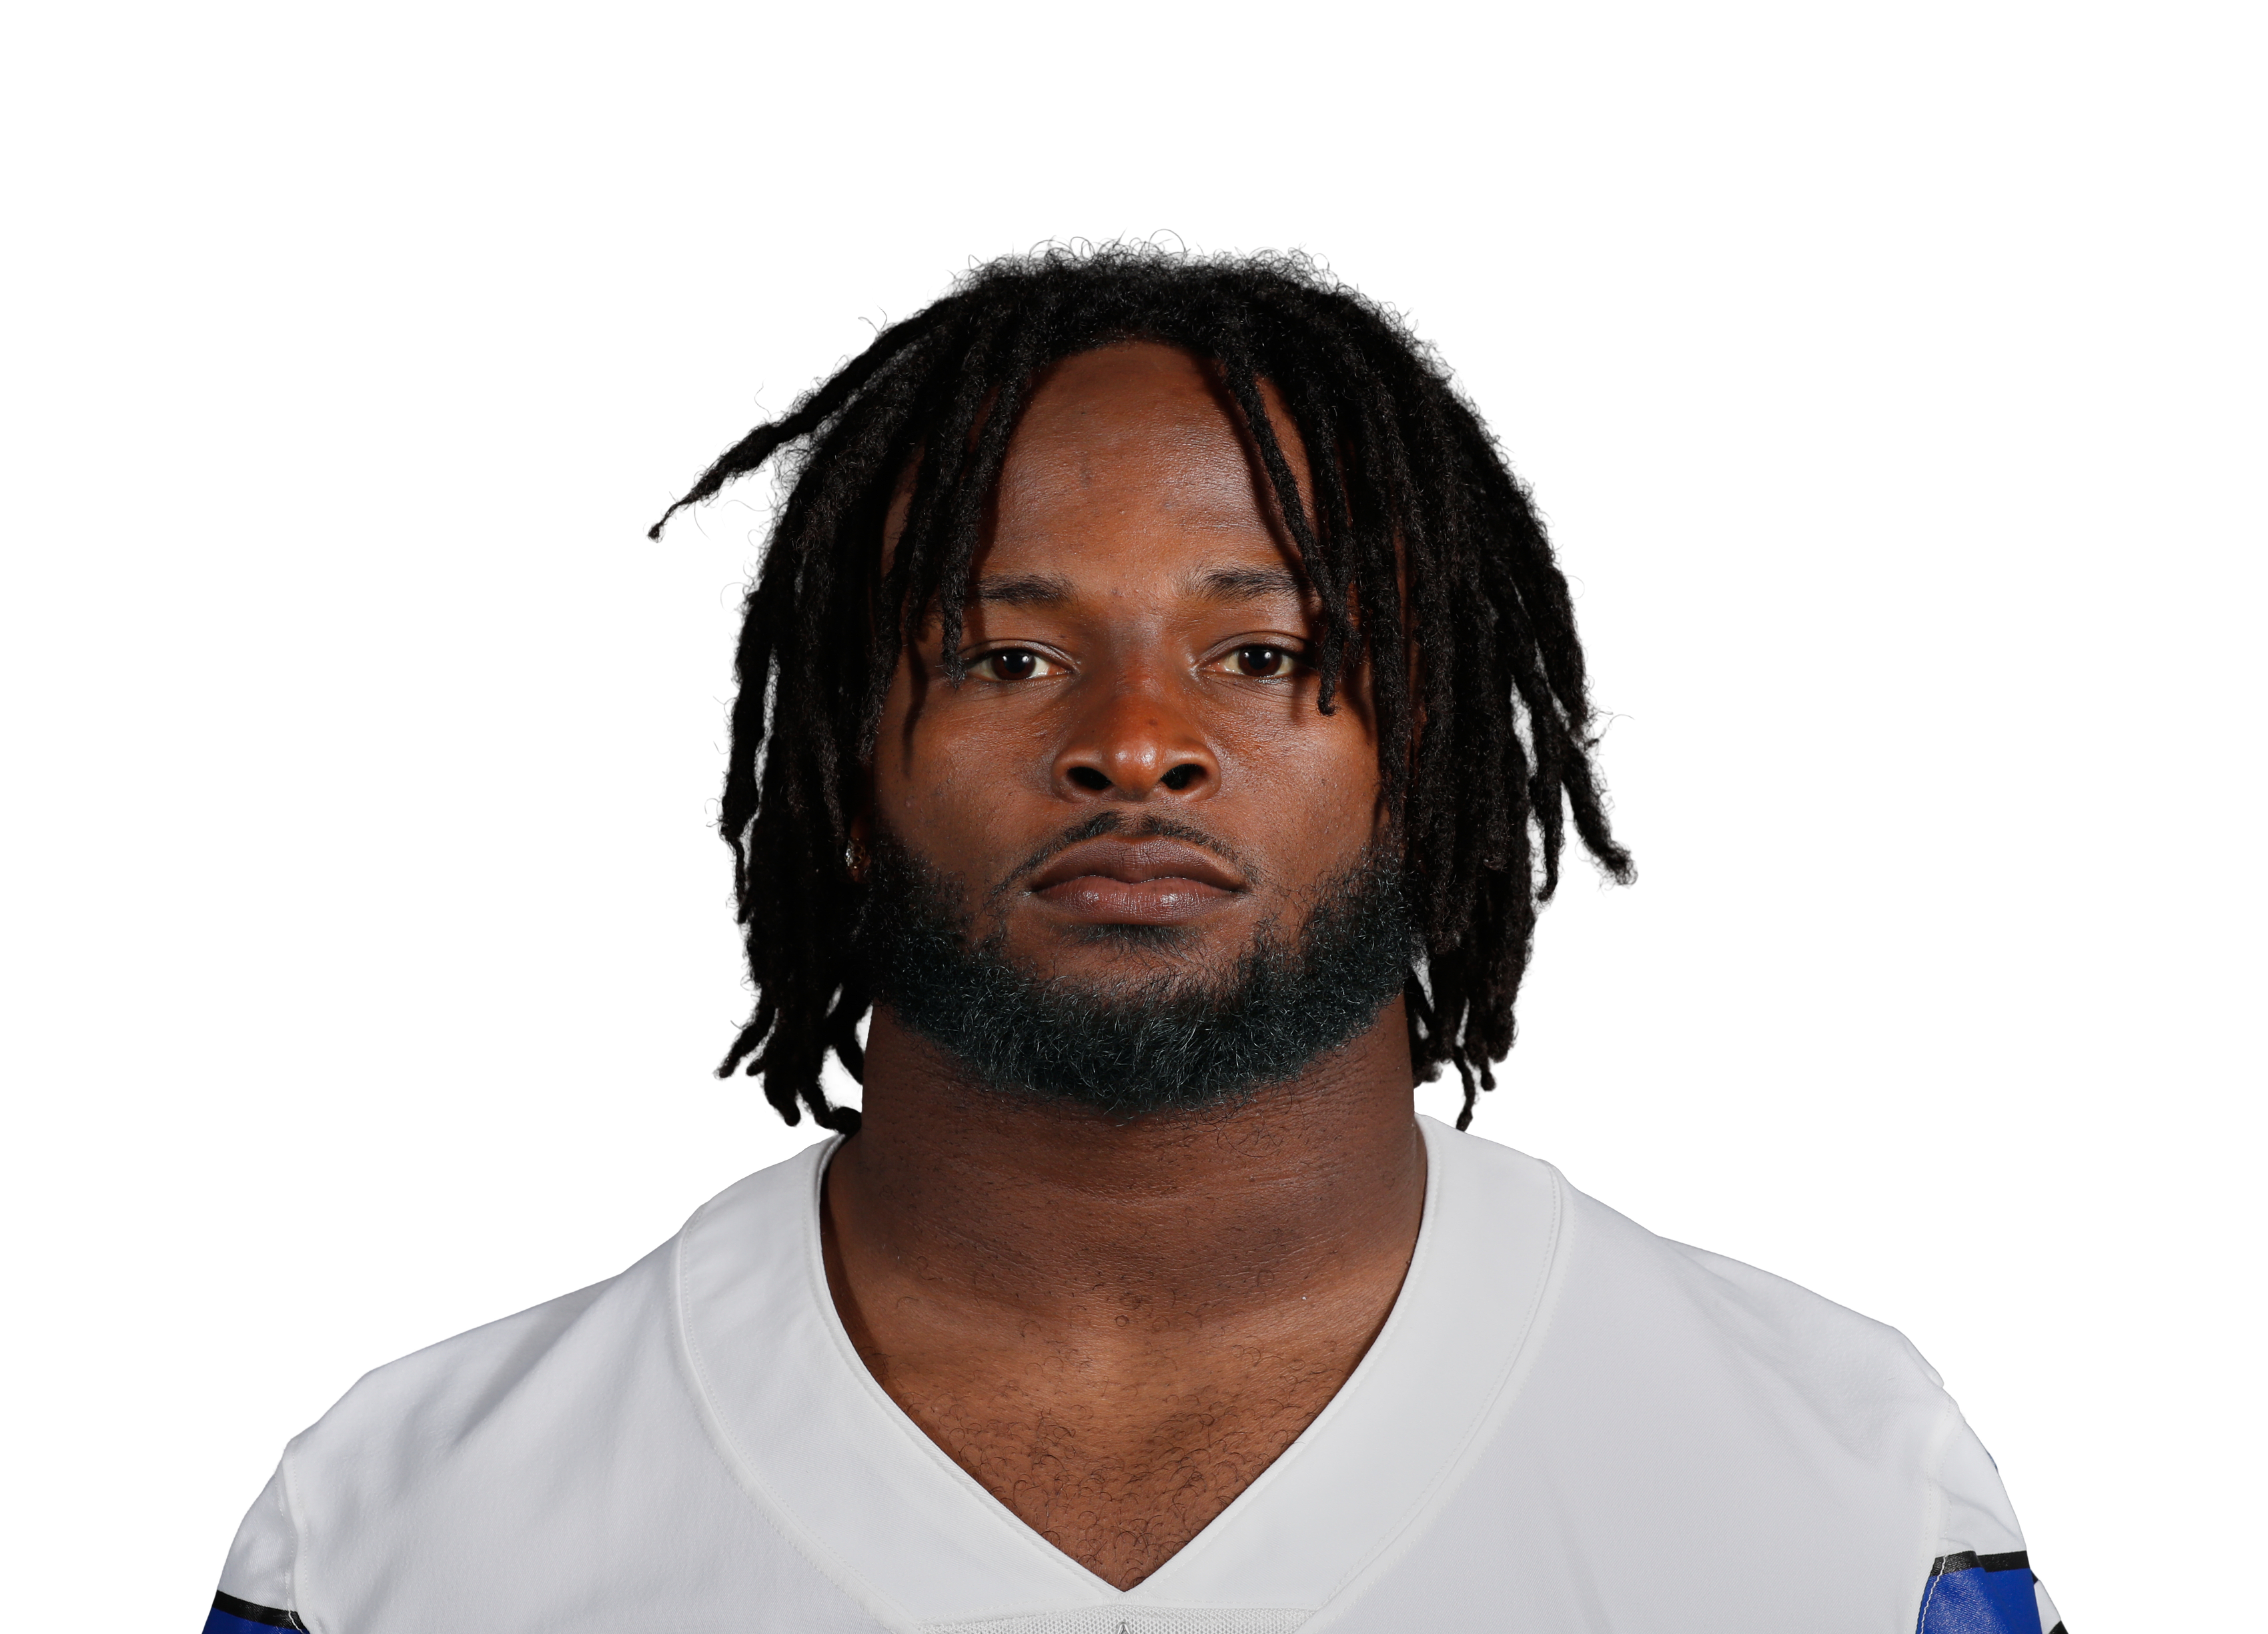
80% of the team's carries inside the 10
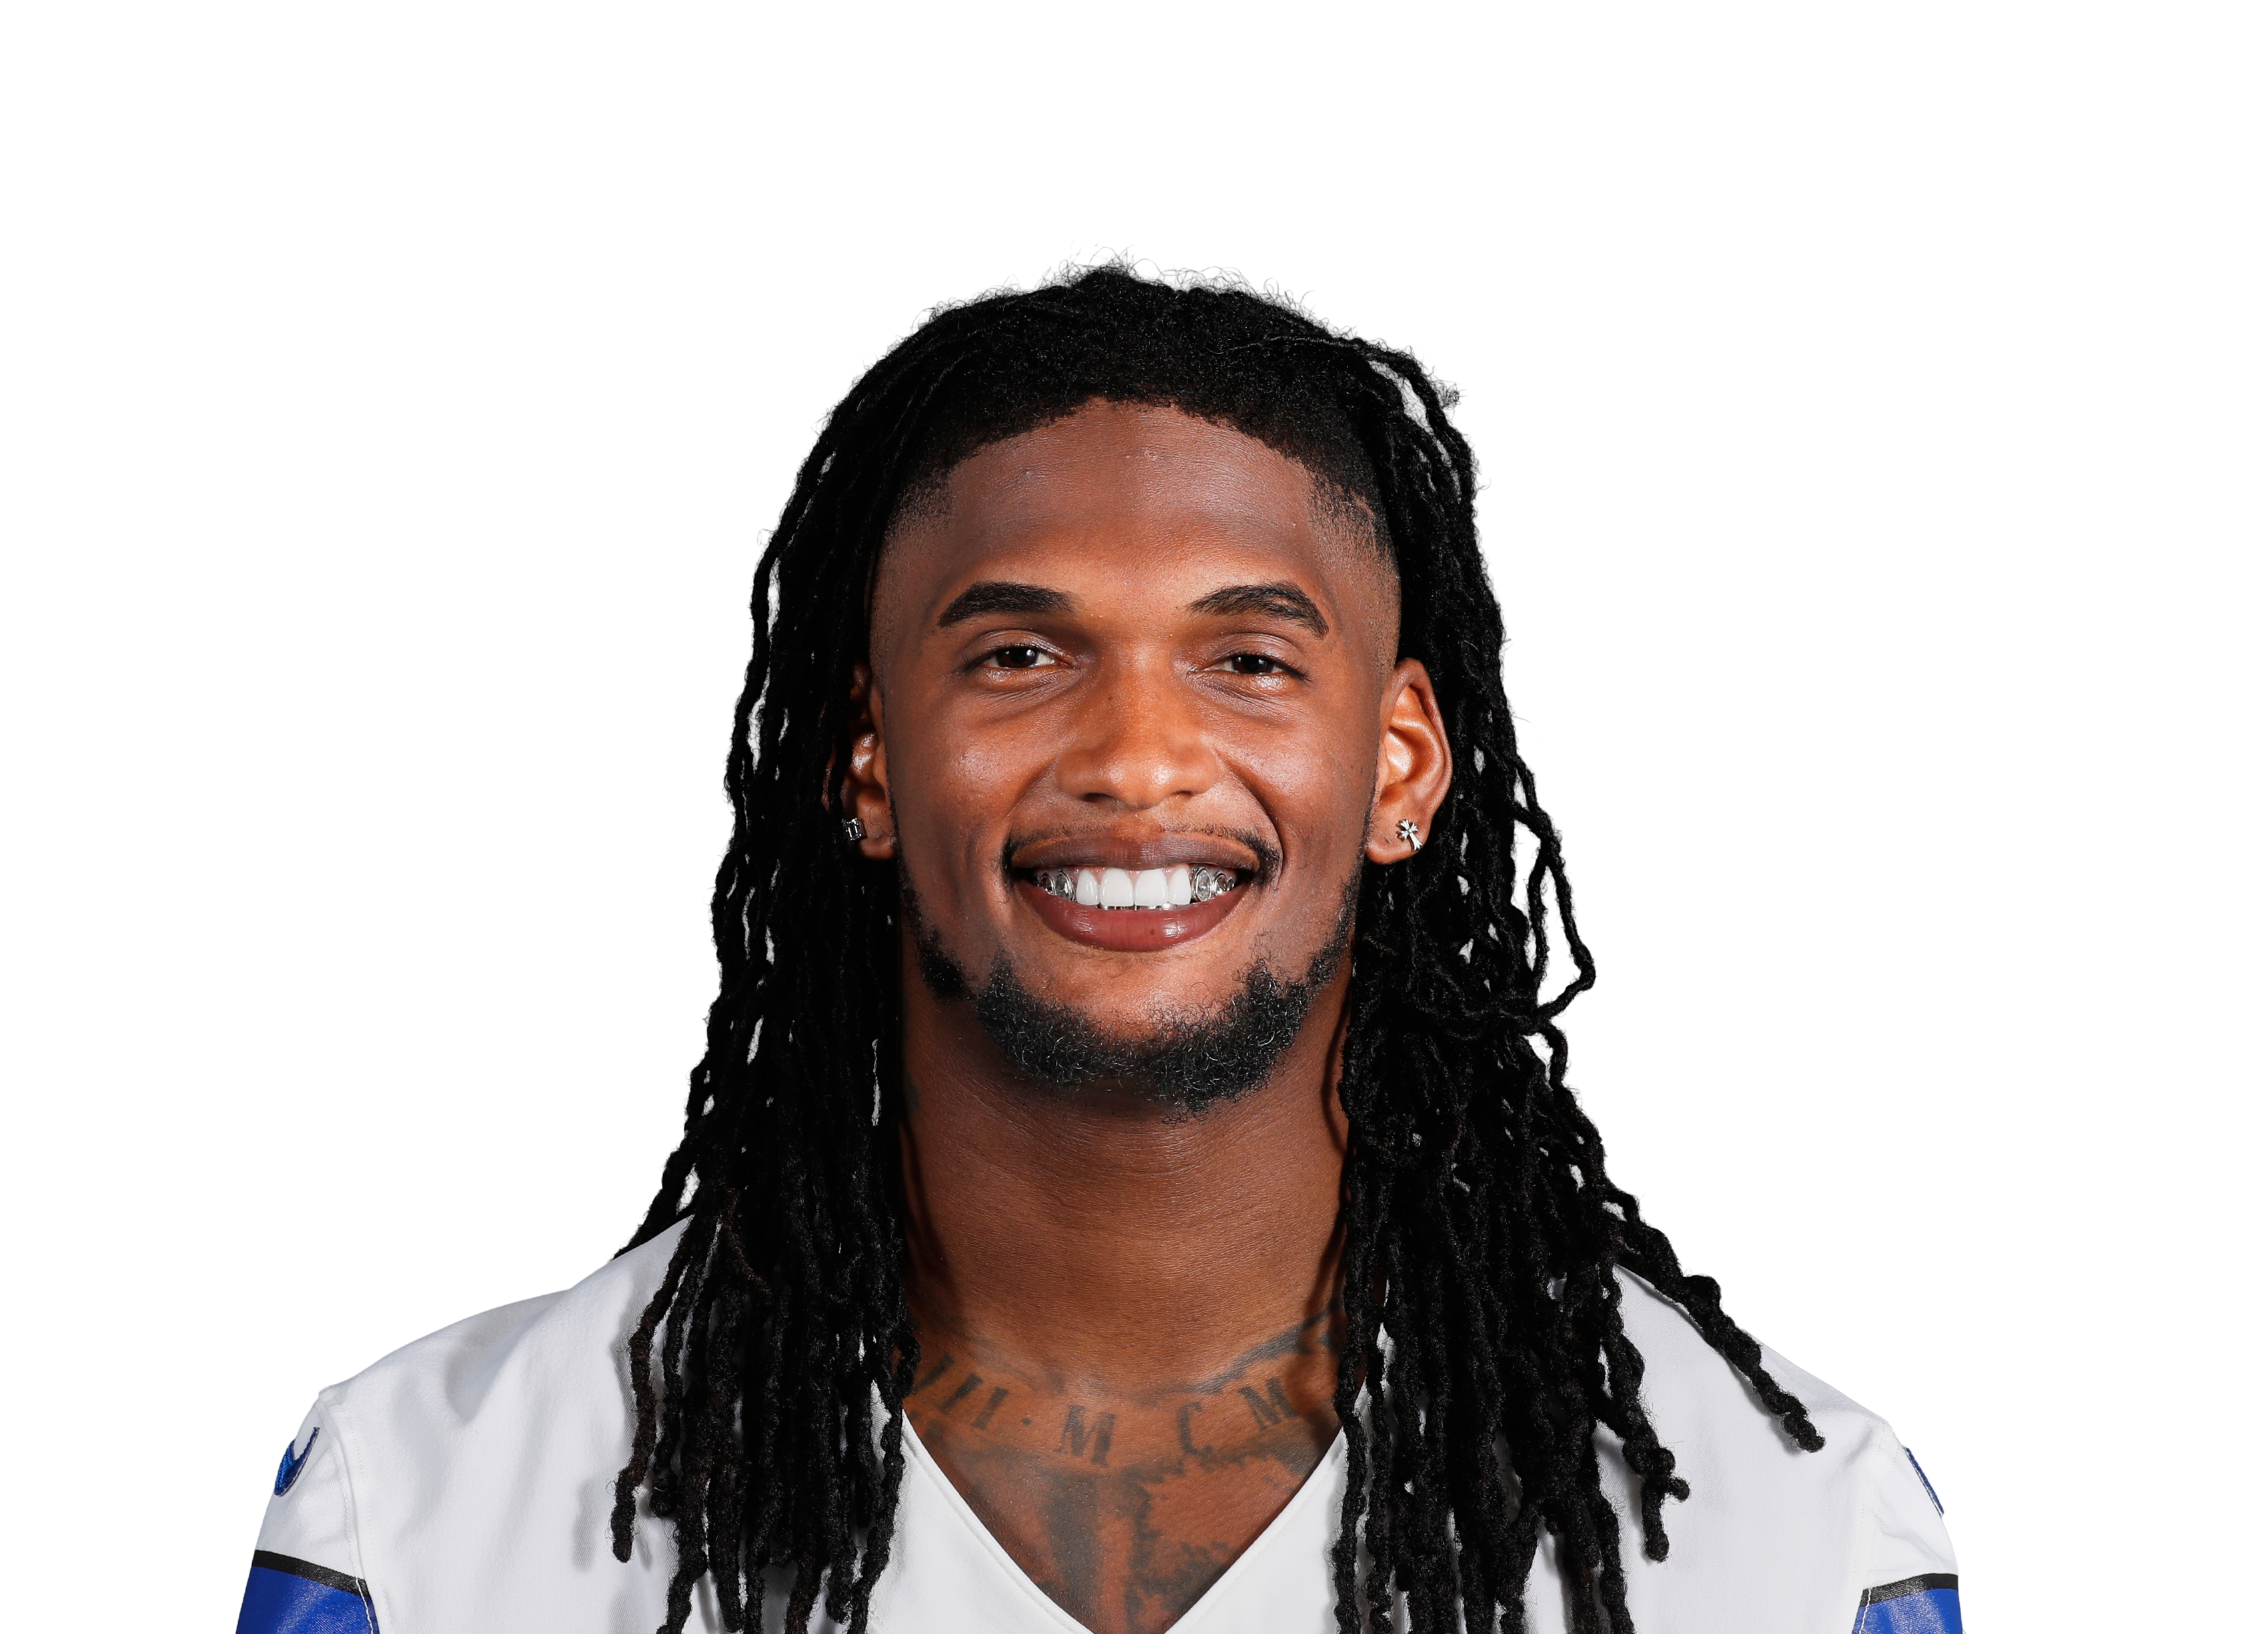
41% of the team's end-zone targets
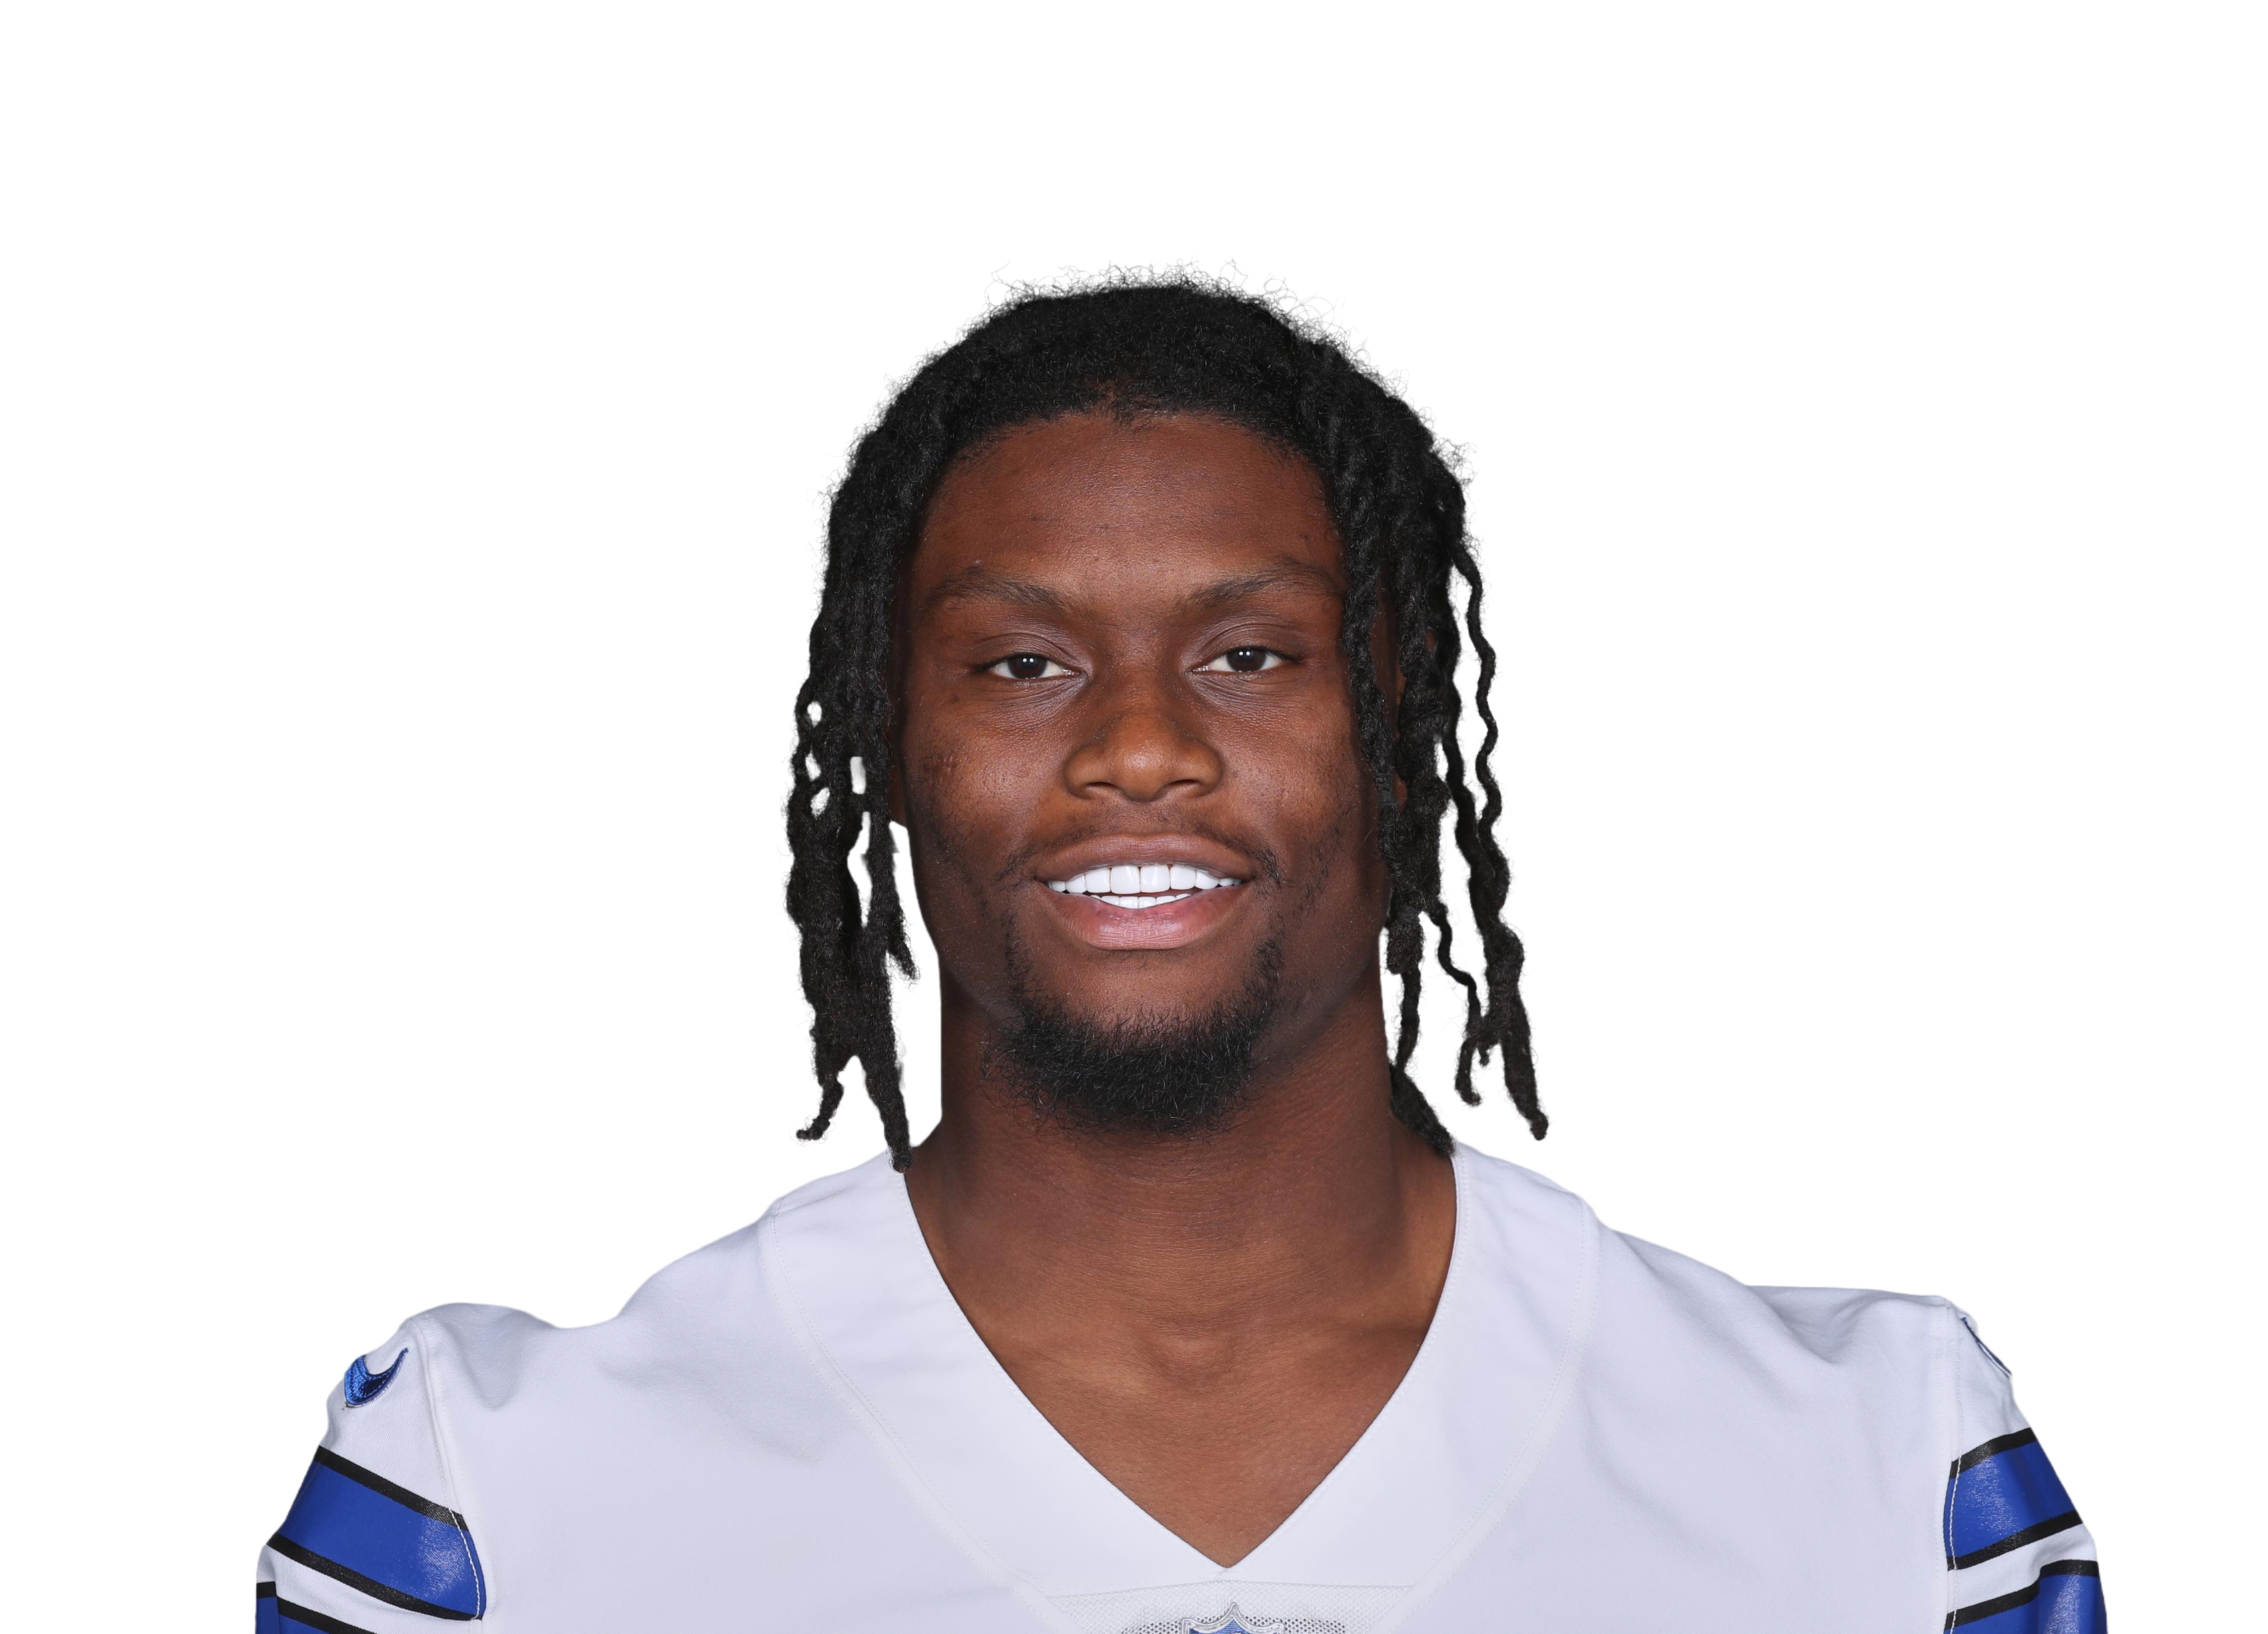
23% of the team's end-zone targets
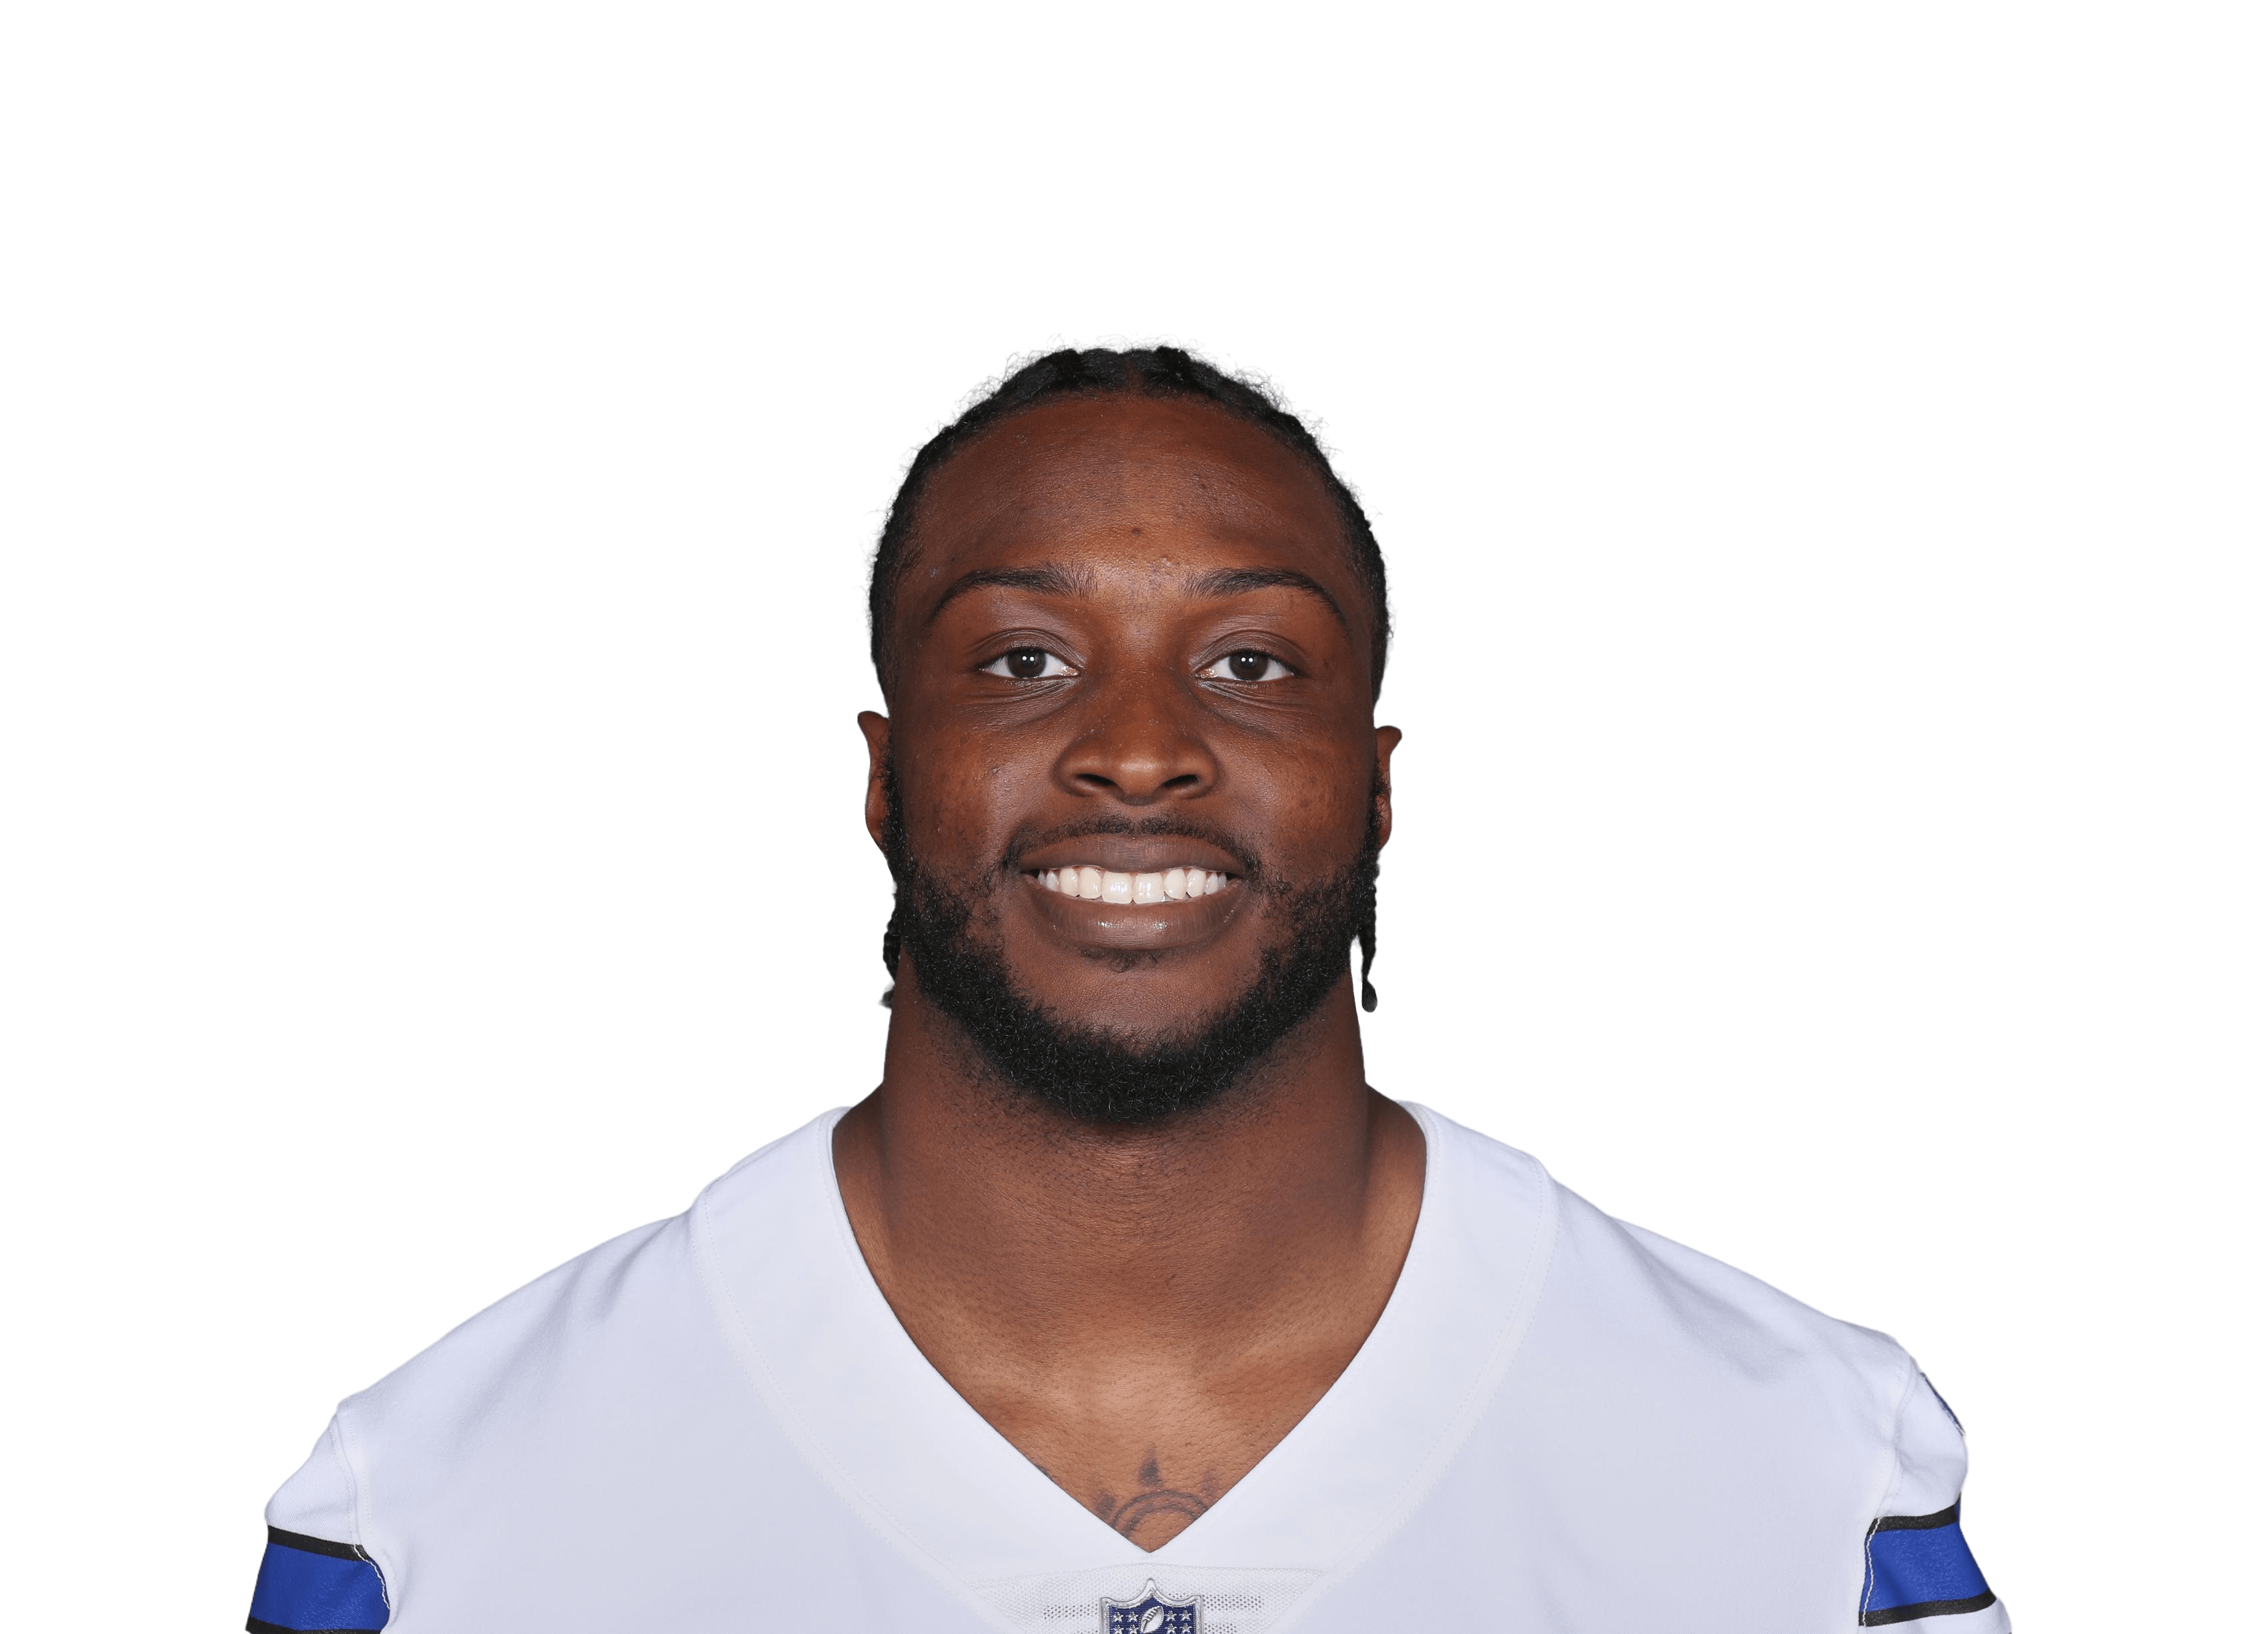

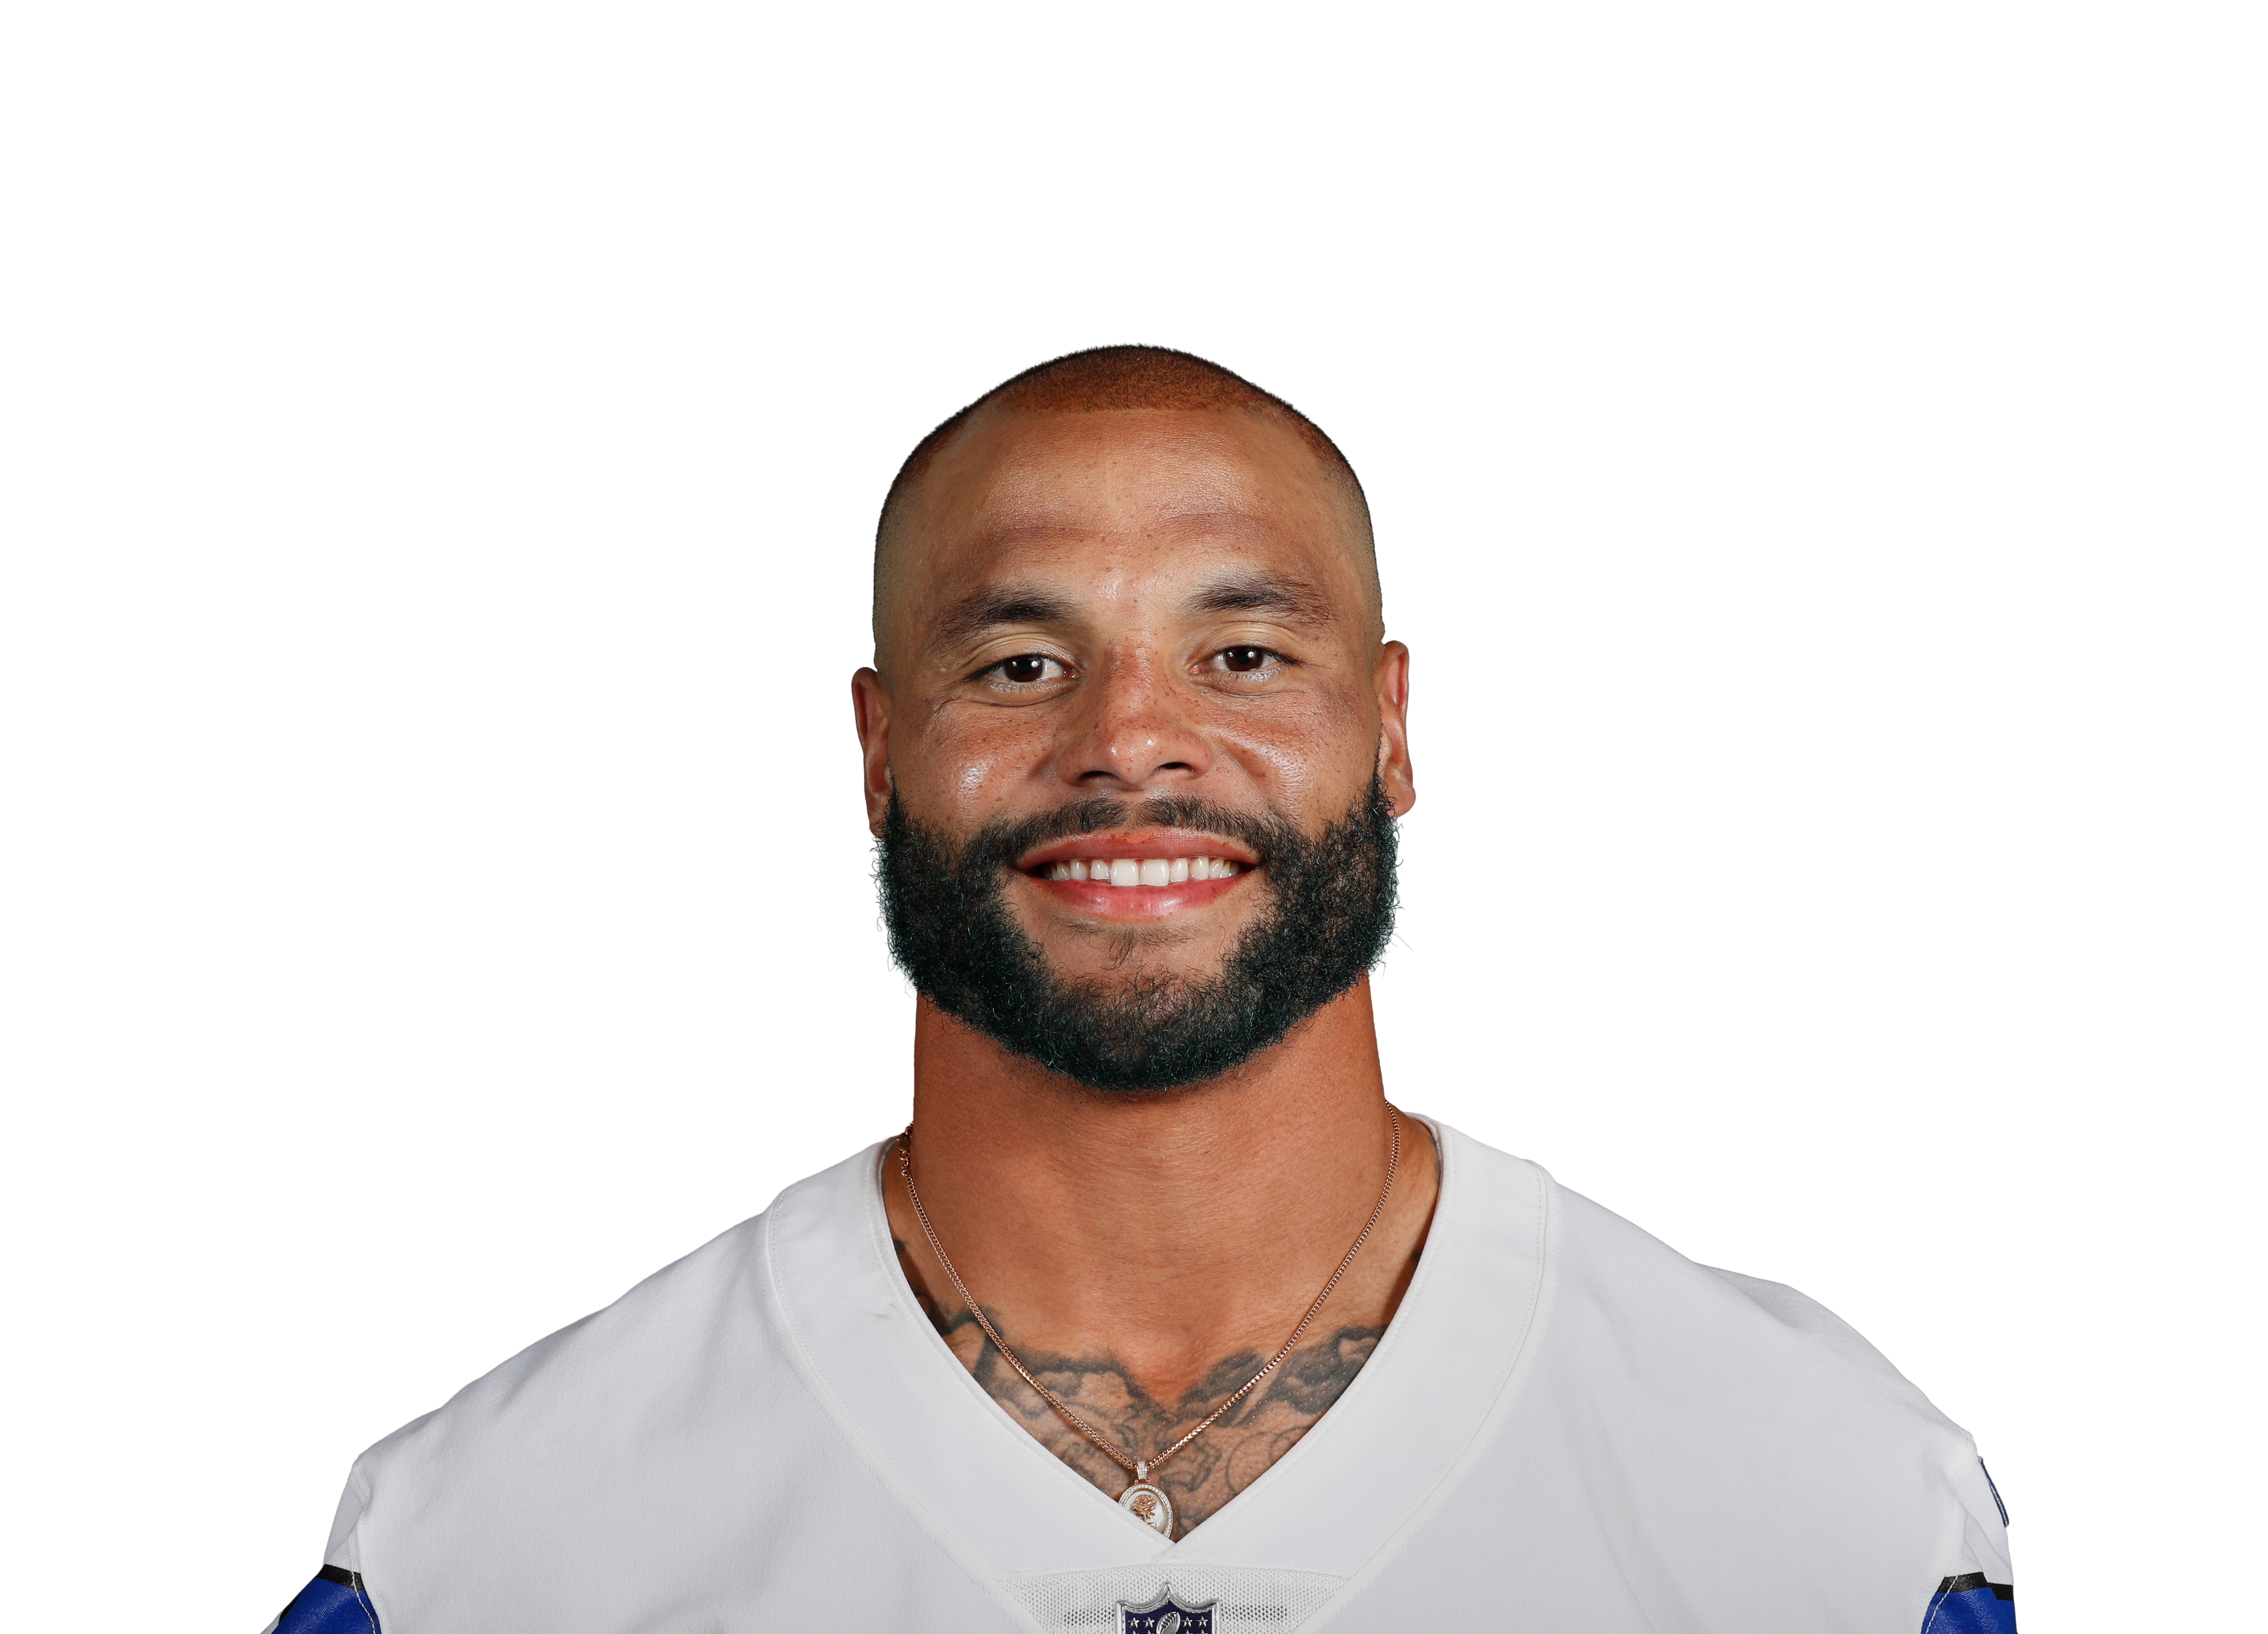
 Philadelphia Eagles
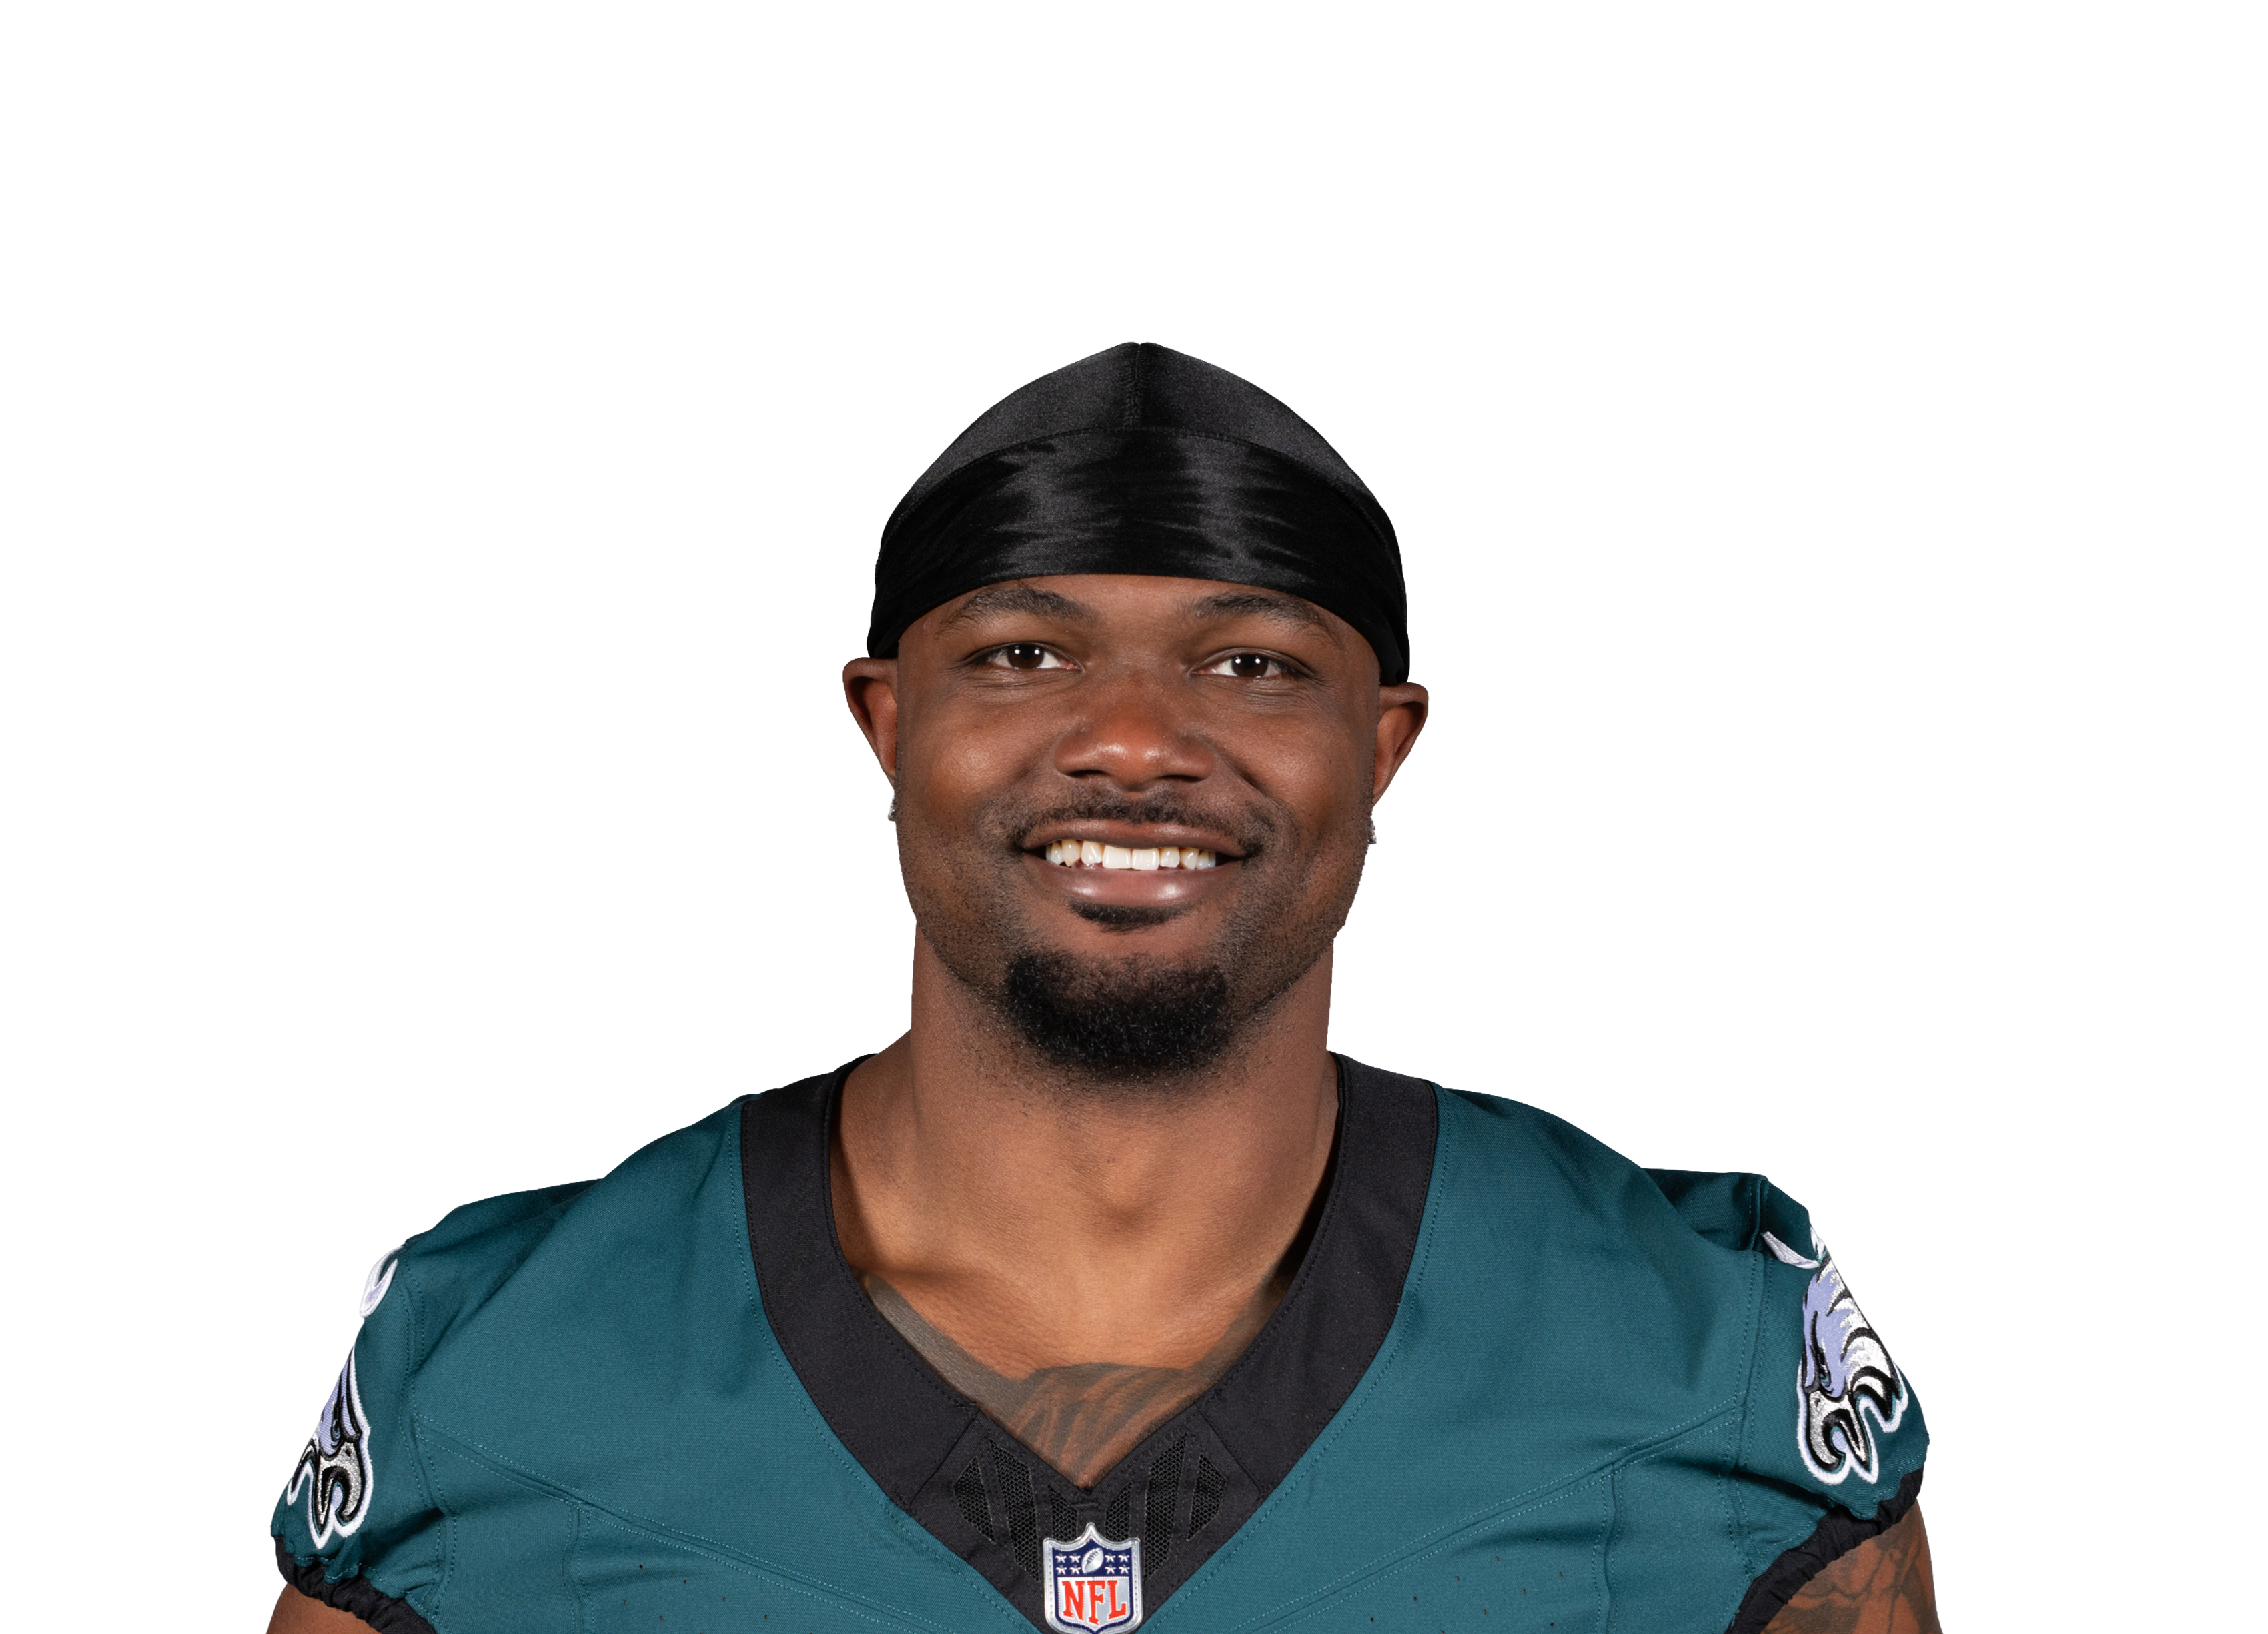
Cowboys have allowed 1.2 TDs a game to running backs lately (average 0.9) · Vegas has the Eagles at about 20 points, 3 fewer than usual
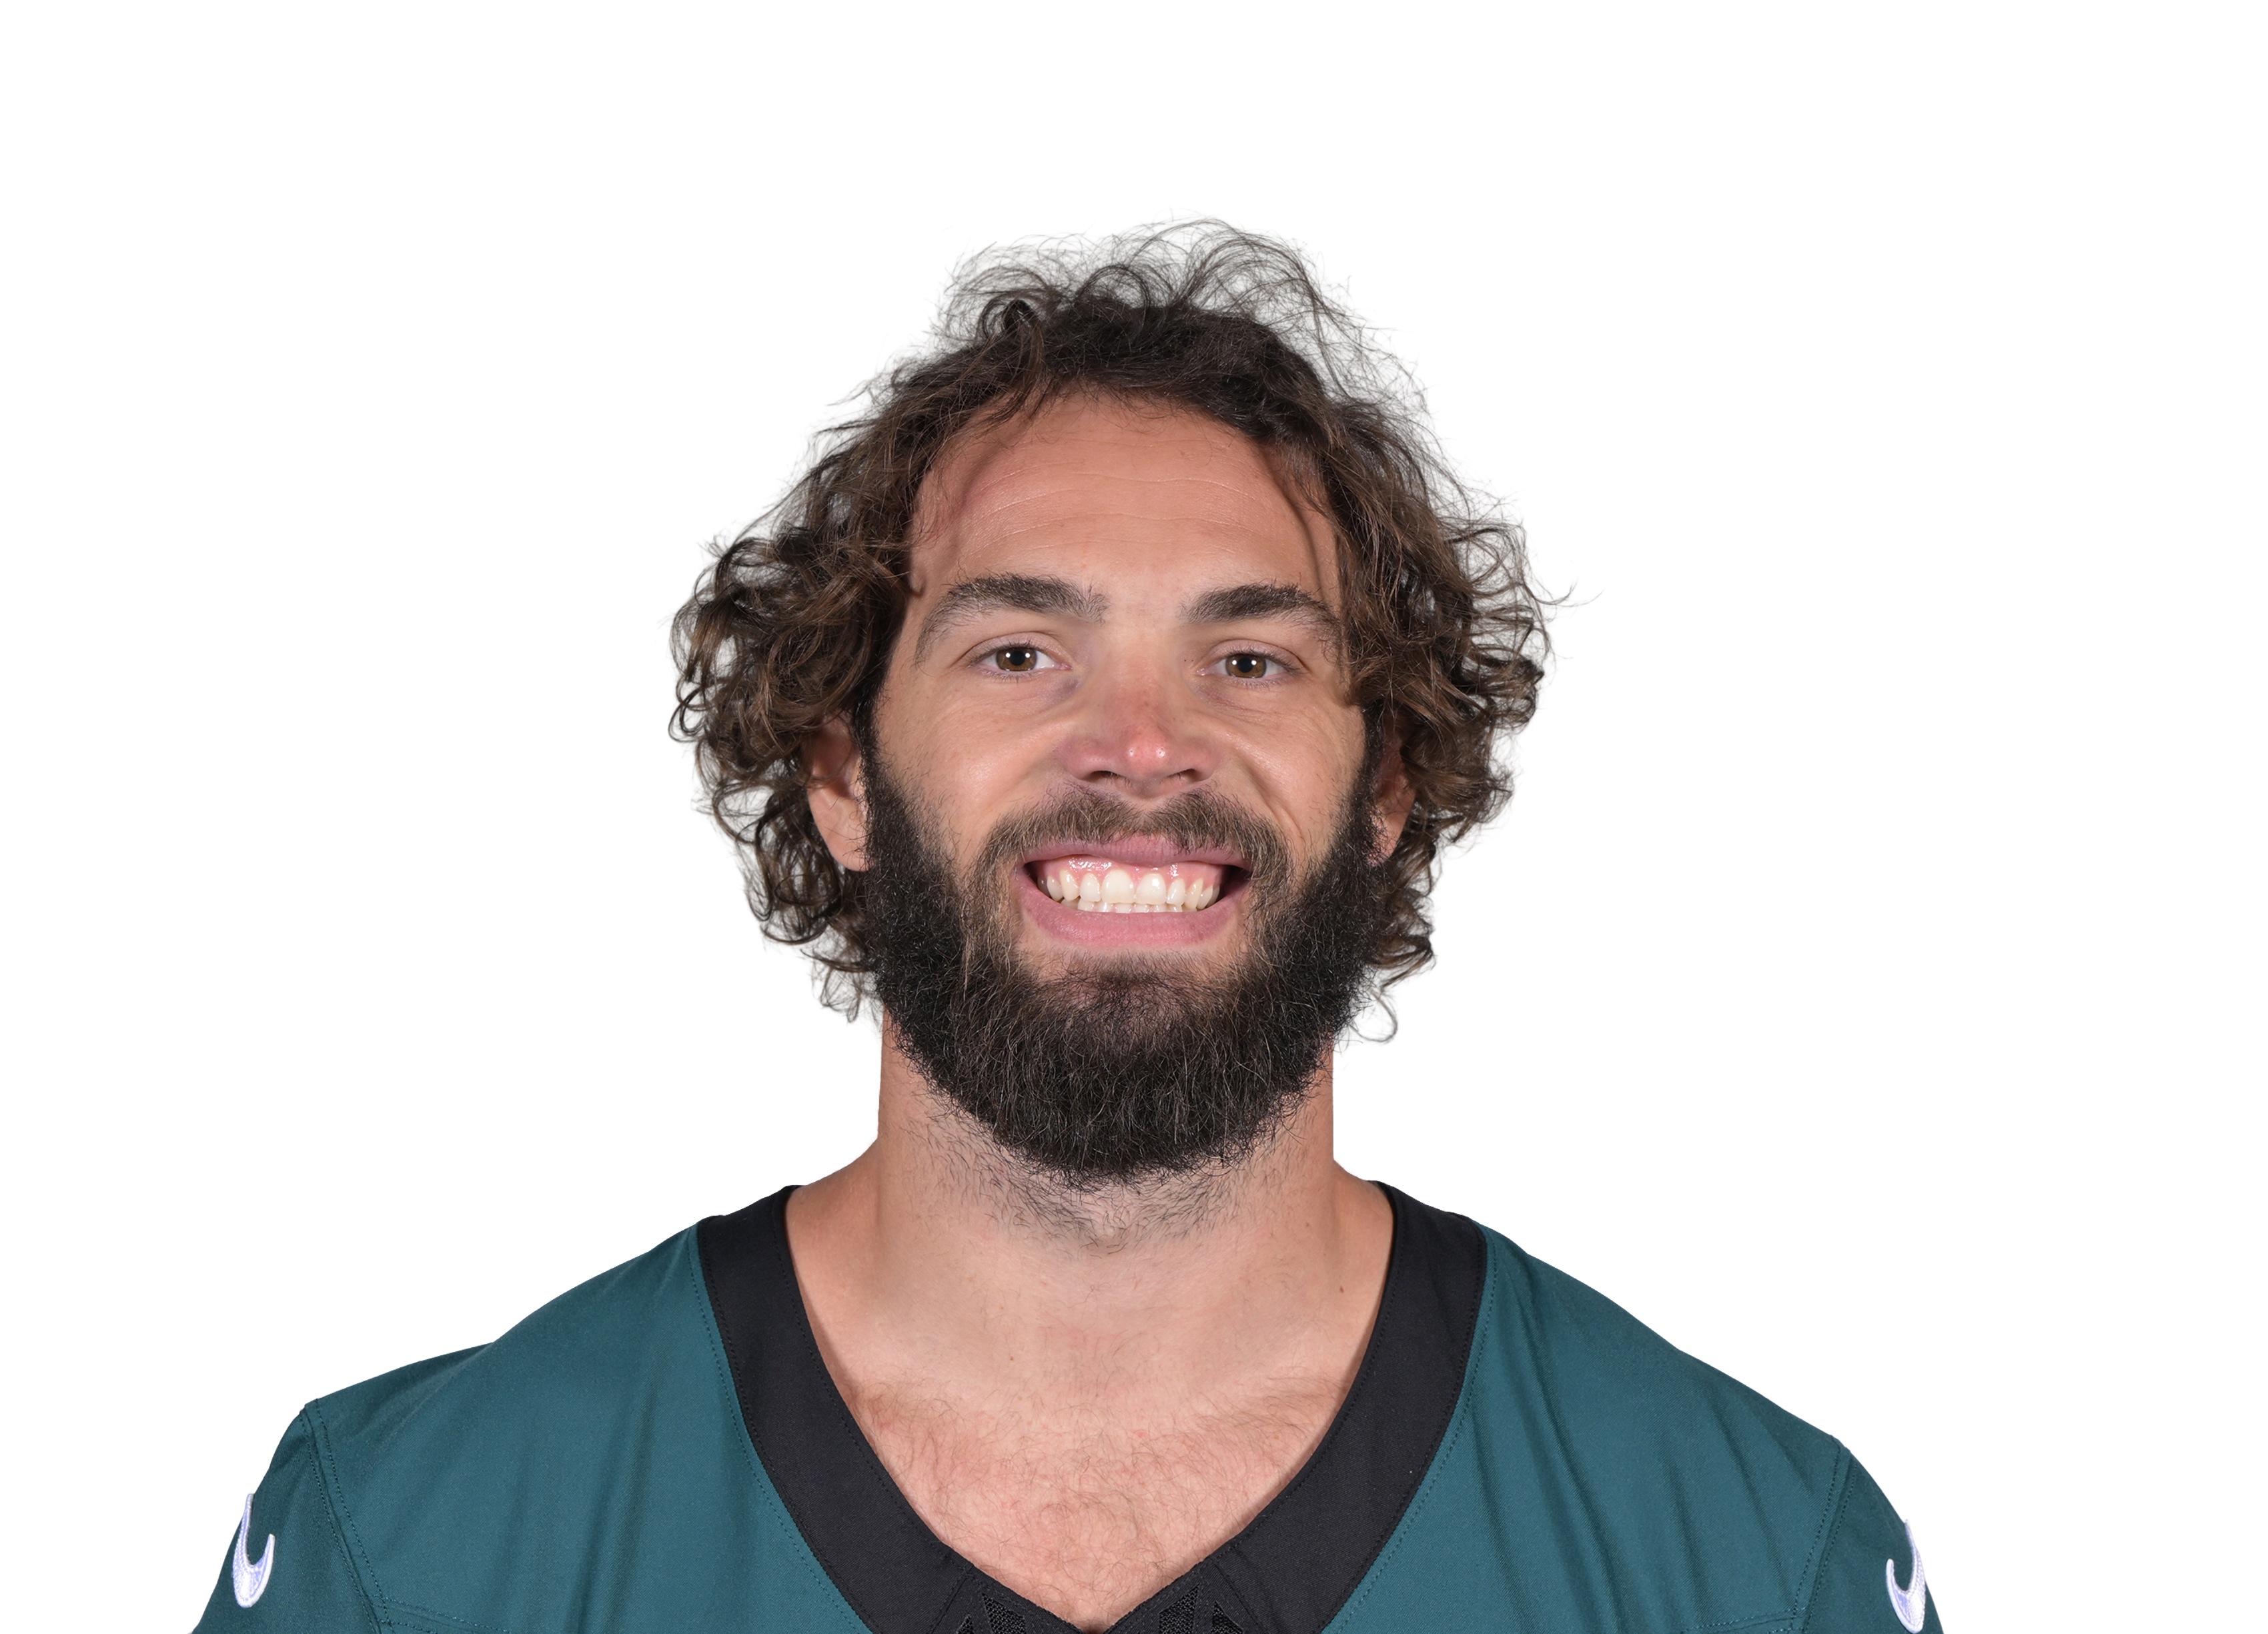
23% of the team's end-zone targets · Vegas has the Eagles at about 20 points, 3 fewer than usual
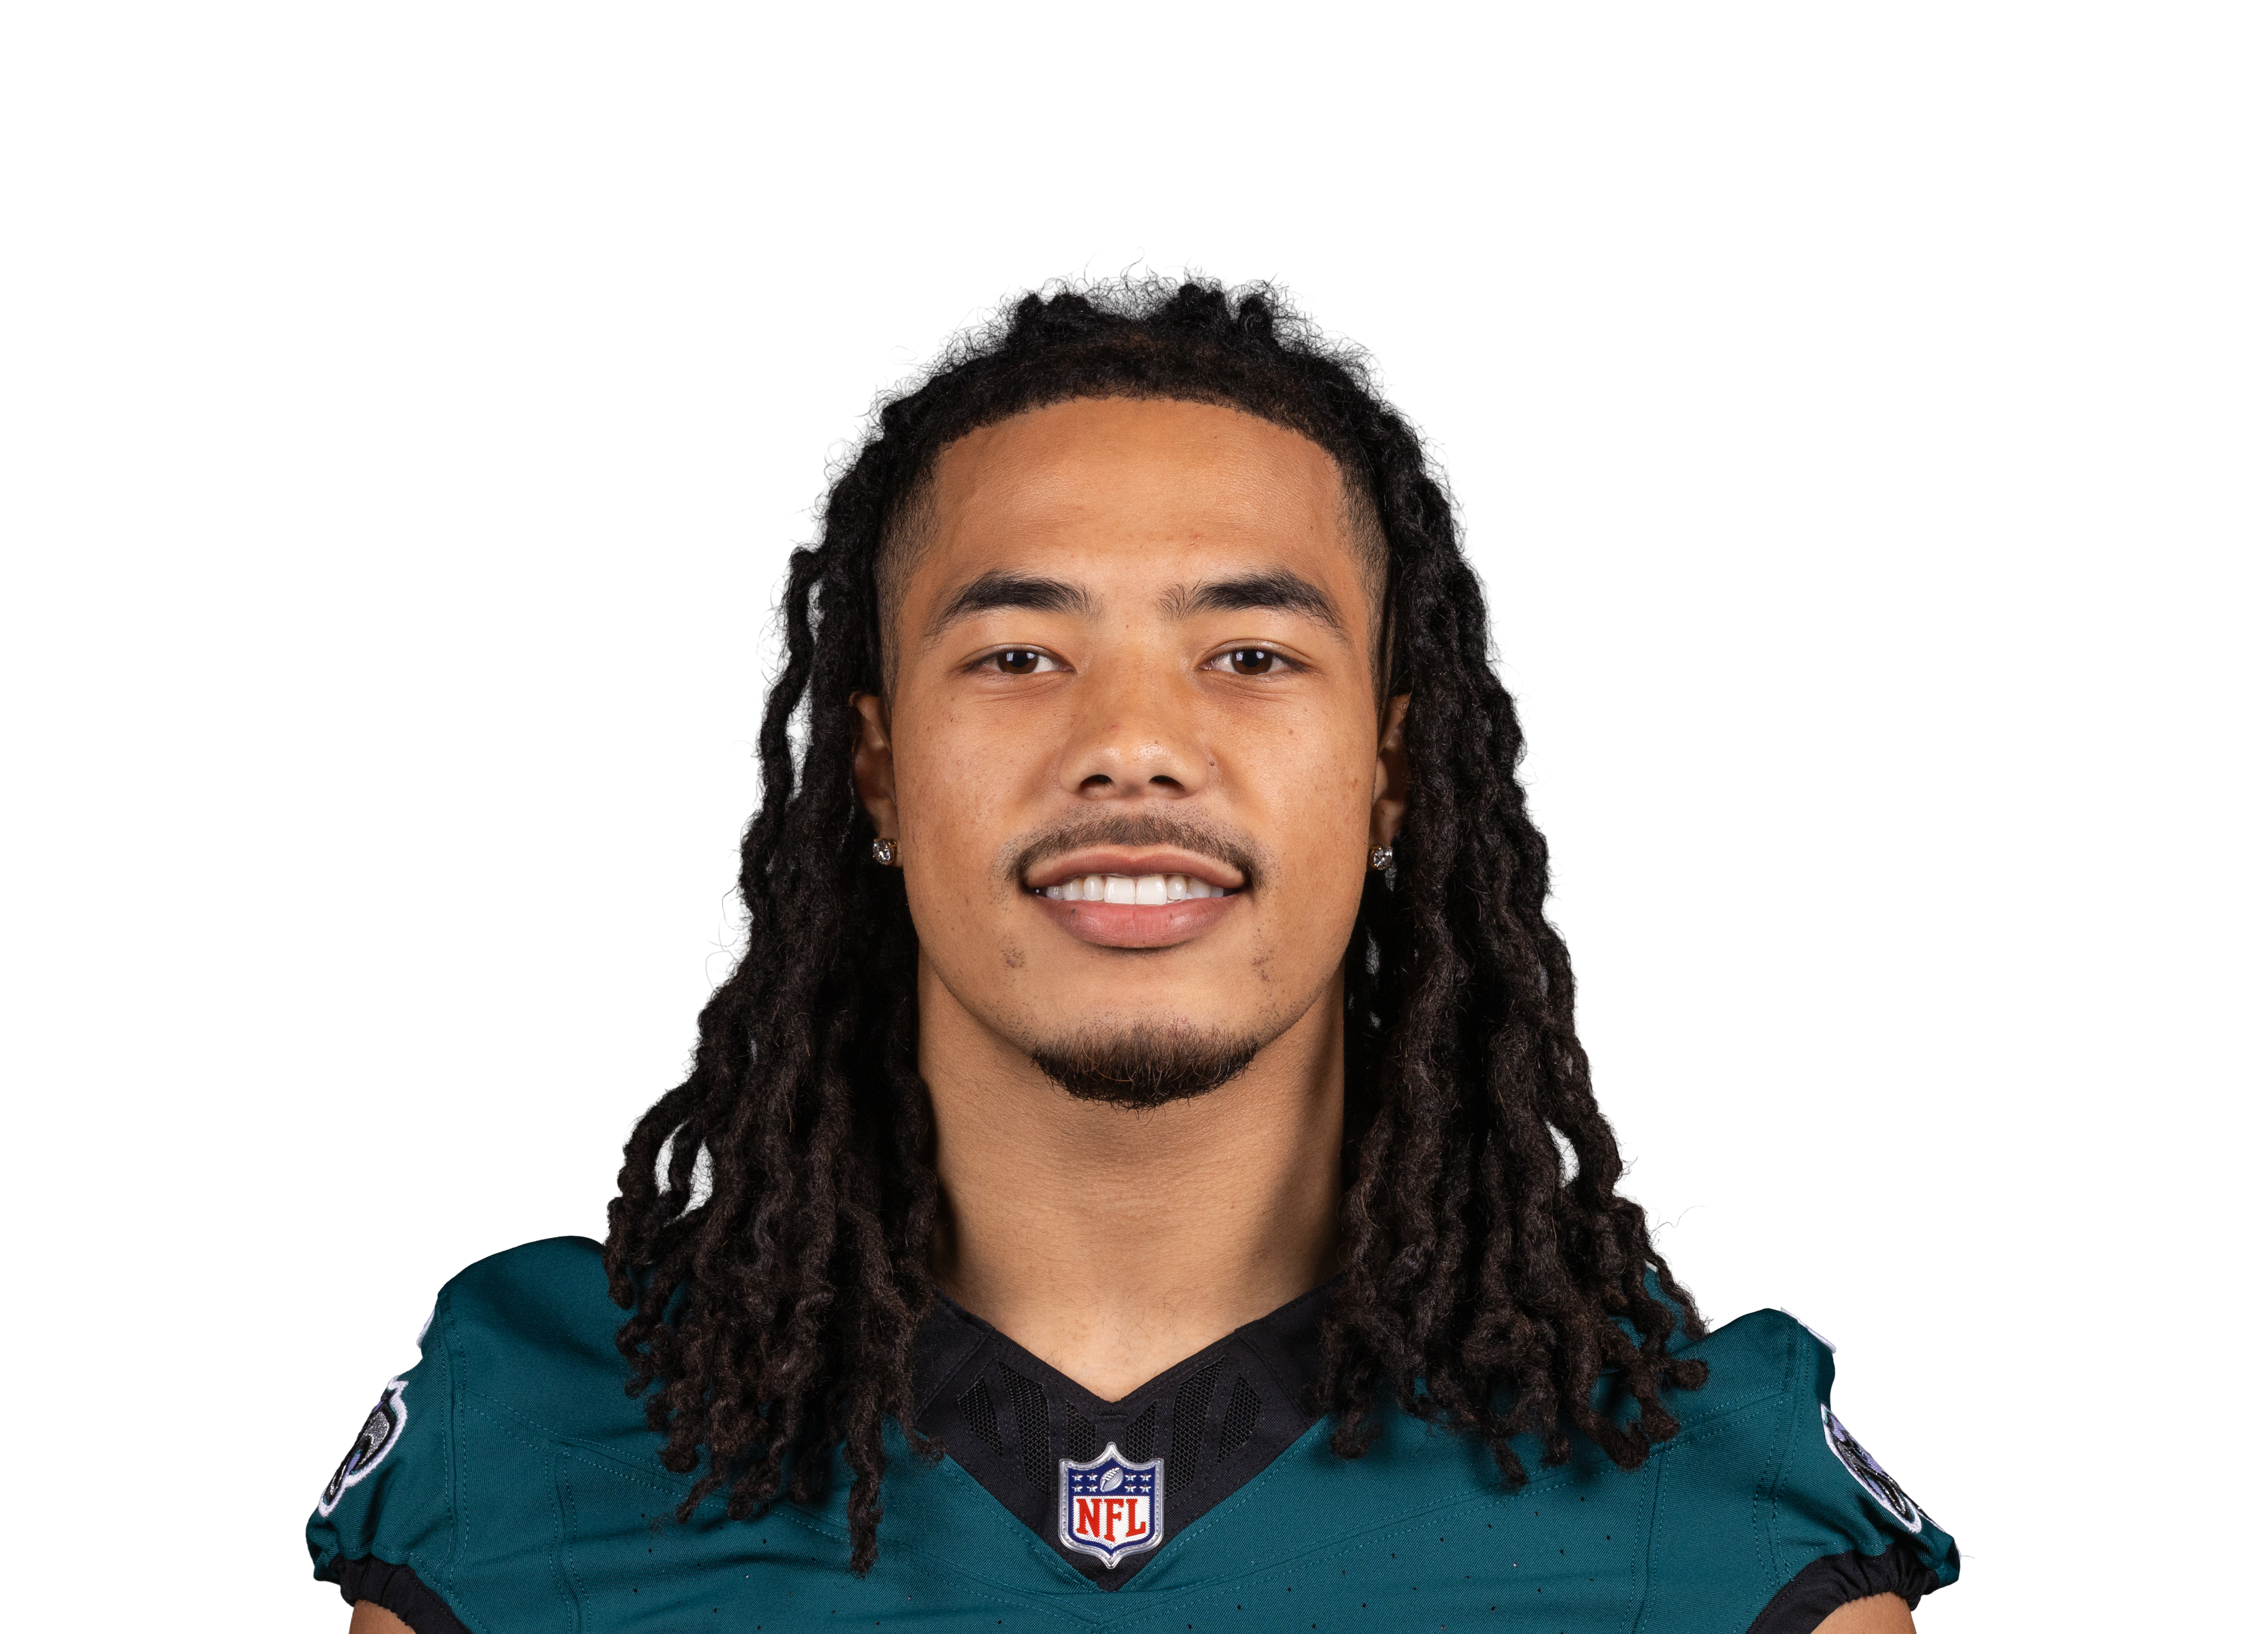
Cowboys have allowed 1.3 TDs a game to receivers lately (average 0.9) · Vegas has the Eagles at about 20 points, 3 fewer than usual
Cowboys have allowed 1.3 TDs a game to receivers lately (average 0.9) · Vegas has the Eagles at about 20 points, 3 fewer than usual
Questionable (full practice): players like him play about 74% of the time; 25% if he plays · 40% of the team's carries inside the 10
Vegas has the Eagles at about 20 points, 3 fewer than usual · A teammate at his position is out: more red-zone work to go around
Player projections
typical game, with the likely range (middle half of outcomes); after the game the actual stat is shown · ▲ 5%+ above his usual · all player props| Dallas Cowboys | |||
|---|---|---|---|
| Passing | Yds | ||
| Dak Prescott QB | 236212 | ||
| Rushing | Yds | ||
| Javonte Williams RB | 56155 | ||
| Dak Prescott QB | 68 | ||
| Tyler Goodson RB | 238 | ||
| Receiving | Rec | Yds | |
| CeeDee Lamb WR | 6.25 | 7374 | |
| George Pickens WR | 5.14 | 6257 | |
| Ryan Flournoy WR | 3.54 | 3570 | |
| Jake Ferguson TE | 2.40 | 160 | |
| Javonte Williams RB | 2.20 | 120 | |
| Philadelphia Eagles | |||
|---|---|---|---|
| Passing | Yds | ||
| Tanner McKee QB | 226211 | ||
| Rushing | Yds | ||
| Saquon Barkley RB | 4162 | ||
| Dameon Pierce RB | 4047▲ | ||
| Tanner McKee QB | 51 | ||
| Receiving | Rec | Yds | |
| Dallas Goedert TE | 3.85 | 4048 | |
| Makai Lemon WR | 3.37 | 2967 | |
| Darius Cooper WR | 1.61 | 2217 | |
| Dameon Pierce RB | 1.51 | 121 | |
| Johnny Mundt TE | – | 4DNP | |
Quarterbacks
career EPA per dropback (league average is about 0; older seasons count less)STARTED · Cowboys
Dak Prescott
EPA per dropback +0.09
STARTED · Eagles
Tanner McKee
EPA per dropback −0.10Not the usual starter
Injury report
players listed Out, Doubtful or Questionable this week| Dallas Cowboys | ||
|---|---|---|
| KaVontae Turpin | WR · Ribs | Out |
| Drew Shelton | T · Hamstring | Out |
| Dee Winters | LB · Calf | Out |
| Marist Liufau | LB · Forearm | Questionable |
| P.J. Locke | S · Foot | Questionable |
| Philadelphia Eagles | ||
|---|---|---|
| DeVonta Smith | WR · Hamstring | Out |
| Dontayvion Wicks | WR · Ankle | Out |
| Nolan Smith | LB · Concussion | Out |
| Michael Carter II | CB · Abdomen | Out |
| Saquon Barkley | RB · Hamstring | Questionable |
| Grant Calcaterra | TE · Back | Questionable |
| Eli Stowers | TE · Quadricep | Questionable |
| Landon Dickerson | G · Knee | Questionable |
| Jonathan Greenard | LB · Ankle | Questionable |
| Jalyx Hunt | LB · Knee | Questionable |
Cowboys: last 5 games
| L13-23 | Missed | |
| L16-24 | Missed | |
| W34-30 | Covered | |
| L31-34 | Push | |
| W37-20 | Covered |





Eagles: last 5 games





Rating trend
BEAVER Stats: net EPA per play against an average team, entering each weekDALPHI
Loading the thread…
No box score for this game yet.
Closing lines
the last line before kickoff| Book | Spread | Total | Moneyline |
|---|---|---|---|
| Consensus | DAL −4.5 | 43.5 | DAL −225 · PHI +185 |
| BEAVER fair line | DAL −1.3 | 42.7 | DAL −118 · PHI +118 |
Loading…
Tendencies
Season to date. Against the spread and over/under use closing lines.| DAL | PHI | |
|---|---|---|
| 3-4 | Record | 2-5 |
| 1-1 | Home | 1-3 |
| 2-2 | Away | 1-2 |
| 3-3 | Against the spread | 1-6 |
| 5-2 | Over/under | 4-3 |
| 27.0 / 25.7 | Points for / against | 18.1 / 25.0 |
| +1.3 | Avg margin | -6.9 |